Version 2.57 - February 2018 Release Notes
Notable Changes and New Features
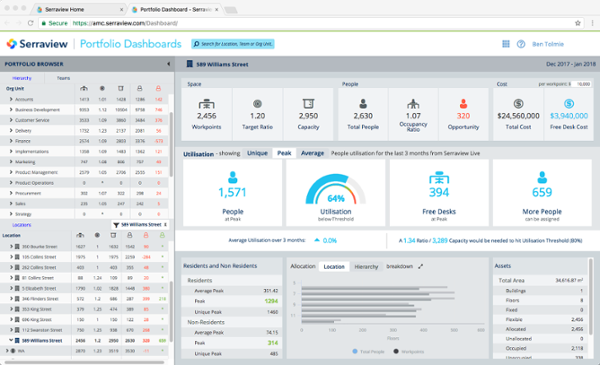
Improved Portfolio Dashboards with Utilization Data
Portfolio Dashboards on the Landing Page now has new navigation and dynamic functionality that will let you drill deeper into the report for more insight into how your space is being used. Using empirical data, you can effortlessly gain a more accurate picture of how your employees are interacting with your space at a floor, building or regional level as well as across teams, functions or Business Units.
Portfolio Dashboards supports Serraview's unique expertise in leveraging Internet of Things (IoT) technology to help CRE organizations to better understand their space usage so they can make smarter space planning decisions. With the new Portfolio Dashboards, you can:
- Set space utilization thresholds appropriate to your portfolio and then see how the actual usage compares.
- See, at a glance, where you can fit more people or desks into your space.
- Quickly review your costs and see where you can improve efficiencies.
- View how your space is being used by employees and those assigned to the space.
- View a summary of your entire portfolio's total area (SQM/Sq Ft) and attributes.
SVLive
Serraview introduced new technologies that improve the performance and scalability of SVLive. Now you can get better, more reliable data as part of your upgraded, smart environments experience.
We also now support the ability to capture utilization data from MAC OS users. If you are interested in rolling out SVLive to your MAC environment, contact your Custom Success Manager.
Chargeback
Terminology changes
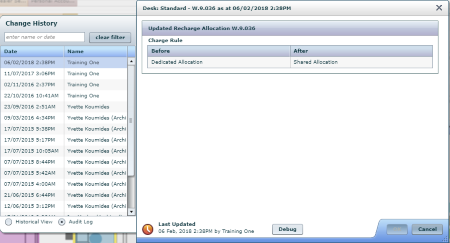
The Chargeback process is familiar to many of our current clients, with allocation reports provided regularly to Finance departments using Serraview data. To align our terminology and cater to a global market, we are changing our previous term 'Recharge' to 'Chargeback' across the user interface and in both default and custom reporting. We have also renamed the existing Charge Rules as follows:
- 'Chargeable' to 'Dedicated Allocation'
- 'Common to Floor' to 'Floor Common'
- 'Common to Building' to 'Building Common'
- 'Non-Chargeable' to 'Non-Usable Area'
This change has been reflected in all existing default and custom reports.
Enhancement - Added New 'Shared Allocation' Charge Rule
Designed primarily for those using Chargeback by area (as opposed to by workpoint), this new Charge Rule allows you to share costs for a single space against multiple teams on a floor using a percentage value. For example, a Meeting Room is charged to Team A - 60% & Team B - 40% regardless of whether the space can be allocated to a team or not or which team it is physically blocked to.
Unlike the other Charge Rules, there is no restriction around whether the space 'Can Allocate To Org Unit' or not (supports both).
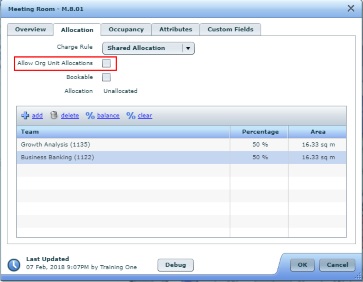
When adding Shared Allocation data, team selection is filtered to teams that exist on the floor. This is the intentional behavior to reduce complexity.
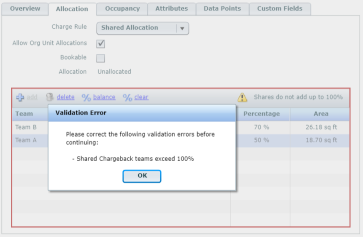
If shared allocation is under 100%, we visually highlight this to the user with a red box around the user interface and a generic warning message stating, 'Shares do not add up to 100%'.
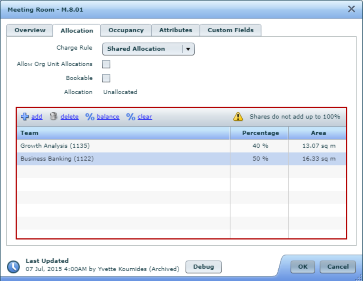
Ideally a space with the shared allocation charge rule will always be fully allocated (100%). Where the shared allocation does not equal 100% for a space, the balance is defined as unallocated space, and falls under the floor's Unallocated Bill To Policy, as seen on the Floor form on the Space & Costs tab.
If shared allocation is over 100%, we visually highlight this to the user with a red box around the user interface and a generic warning message stating, 'Shares do not add up to 100%'. A secondary dialog validation error is generated if the user attempts to save.
Additional Functionality
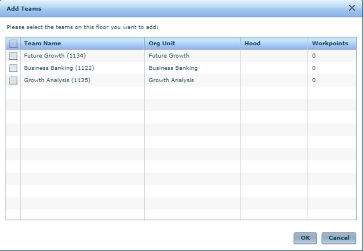
- The
 link opens the Add Teams dialog; this link is disabled if all the teams on the floor have been added.
 - The
 delete link will delete the selected row.
 - The
 link will adjust the percentage across all teams as evenly as possible to get 100%.
 - The
 link will set the percentage of the selected row(s) to 0%.
Change History
The change history only records where the charge rule is changed. It does not record the detail of percentage changes.
View in Space Mapping
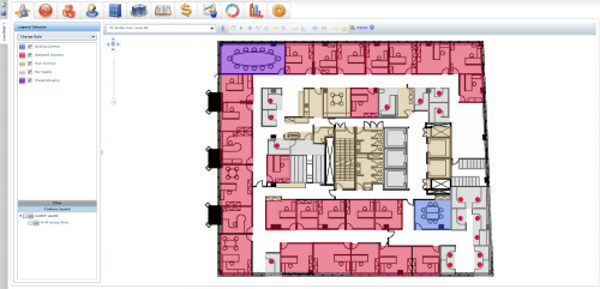
You can see the Charge Rules on a floorplan in the Charge Rule view of Space Mapping module.
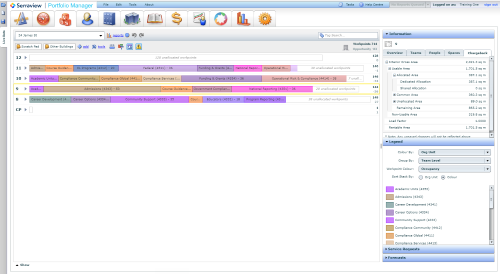
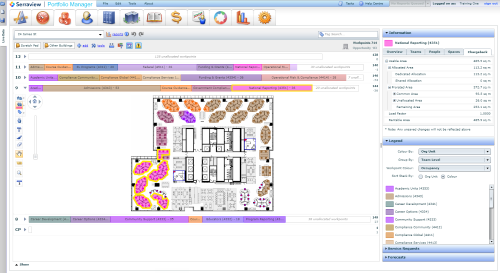
Enhancement- The Visual Block and Stack's Information panel has a new Chargeback tab. This shows the breakdown for the Interior Gross Area, Usable Area, Non-Usable Area, Load Factor and Rentable Area. You can view the chargeback breakdown for:
Building, Floor or Hood selected
The chargeback tab displays the chargeback breakdowns as shown below.
Org Level or Team selected
The chargeback tab displays the chargeback breakdowns, as shown below.
Enhancement- A new report 325 - Chargeback Report has been created, displaying a breakdown of the chargebacks broken down by Org Unit, Team, Floor, Building. This will eventually replace our existing seeded report #73.
Minor Changes
Workplace
Enhancement - New secured actions for the Attributes field. The secured actions are:
- Workplace - View Desk Attributes
- Workplace - Edit Desk Attributes
Visual Block and Stack (VBS) / Scenario Planner
Enhancement - The Target Ratio can now be incremented by 0.01 or you can enter the value. This will allow for more accurate Capacity and Opportunity statistics.
Enhancement - There is new functionality around how target ratios are displayed within the Information pane. When a single team is selected, the Target Ratio for the selected item is displayed. When a user selects multiple teams, hood(s), or floor(s), it will show 'Derived Target Ratio' in the Information pane. The Derived Ratio is equal to the Capacity/Total Workpoints.
Fix - When you switch between buildings, any open floors will automatically collapse.
Portfolio Manager
Enhancement - The Manager field is now exposed in the Person details form in Portfolio Manager > Configuration > People. When running a Person import, if a person record has a PersonID in the ManagerPersonID field then the Manager field will be populated and display as a link.
Building and Floors
Fix - Any floors not shown in the VBS will no longer be calculated in the Total Building Area.
Storage, Lockers and Car Parks
Fix - Storage, Lockers and Car Parks, when you create an asset, the asset type selection is sorted alphabetically. This functionality can be overwritten by setting the sequence field in the Configuration tab, under Keywords.
Service Requests
Fix - The secured action Service Request: Receive Assignment emails is now enforced when you send out assignment emails.
Dashboards & Reporting
Enhancement - We have improved our reporting capabilities to allow users to build reports that highlight where employees are spending the most time, despite their assigned locations. The reported data will help CRE to verify the actual locations of their employees and minimize the need to conduct workplace audits. The new fields exposed within Report Builder are as follows:
- Possible Dominant Locations (A list of all locations a person was seen at and for how long. This is based on the configured Occupancy Period and Utilisation Days Threshold)
- Dominant Location Delta (The single dominant location the person was seen at that did not match their assigned location. This will be within the configured Occupancy Period and is equal to or greater than the number of days configured in Utilisation Days Threshold.)
- Dominant Zone Delta (The single dominant zone the person was seen at that did not match their assigned location. This will be within the configured Occupancy Period and is equal to or greater than the number of days configured in Utilisation Days Threshold.)
Fix - When a report is built in the Report Builder in a North American (NA) instance, it will render in reporting dashboards in the preferred NA date format.