Utilization Panel
The Utilization Panel will contain the following tabs:
- Unique tab - This contains statistics on the most people seen over the course of a day.
- Peak tab -This contains statistics on the most people seen at a single point in time.
- Average tab - This contains statistics on the average of each day's peak. Note: This only excludes weekends.
The following utilization settings can be changed, for more information refer to Refer to Configure Utilization.
- Portfolio Dashboards Utilization Period (default setting 3 months)
This displays in the Portfolio Dashboard in the top-right hand corner. For example:
![]()
- Default Utilization Trend Period (default setting 3 months)
This displays in the Utilization Panel. For example:
![]()
- Utilization Threshold (default 85%)
This displays in the Utilization Panel. For example:
![]()
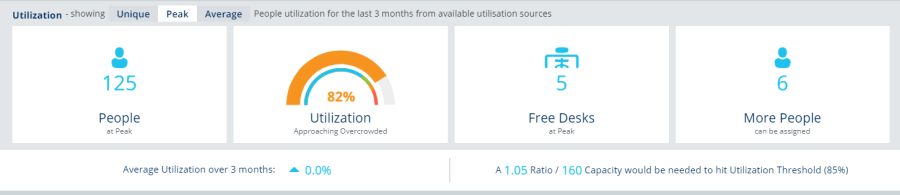
The example below displays the data for floor 27 of 94 Arlowene Street, VIC, Australia and the Utilization Panel's Peak tab was selected.
|
Label |
Description |
|---|---|
|
People at Peak |
The most people seen at single point in time. |
|
Utilization Speedometer |
The Utilization Speedometer displays the percentage of desks in use. The speedometer displays a different color depending on where it is in relation to Utilization Threshold:
The Utilization Threshold defines where the building is running efficiently and over this level the building will become overcrowded. This is calculated by People at Peak divided by Total Workpoints. For example: Peak People = 125 Total Workpoints = 153 125 / 153 = 0.816. Assuming all 125 people used a desk, Utilization is 82%. |
|
Free Desks at Peak |
This is the number of desks free, accounting for the threshold. This is calculated by (Total Workpoints multiplied by Utilization Threshold) minus People at Peak. For example: Peak People = 125 Total Workpoints = 153 Utilization Threshold = 85% (153 * 0.85) - 125 = 5.05 Threshold means we have effectively 130.05 desks (153 workpoints x 85%) to work with. If all 125 people used a desk, 5 would be available before hitting the threshold. Free Desks is therefore 5. |
|
More People can be assigned |
Calculated by Capacity minus (Total People + Retained (Occupied)) For example: Capacity = 184 Total People = 154 Retained (Occupied) = 0 184 - 154 = 30 |