COVID-19 Portfolio Overview - Australia Dashboard
Purpose
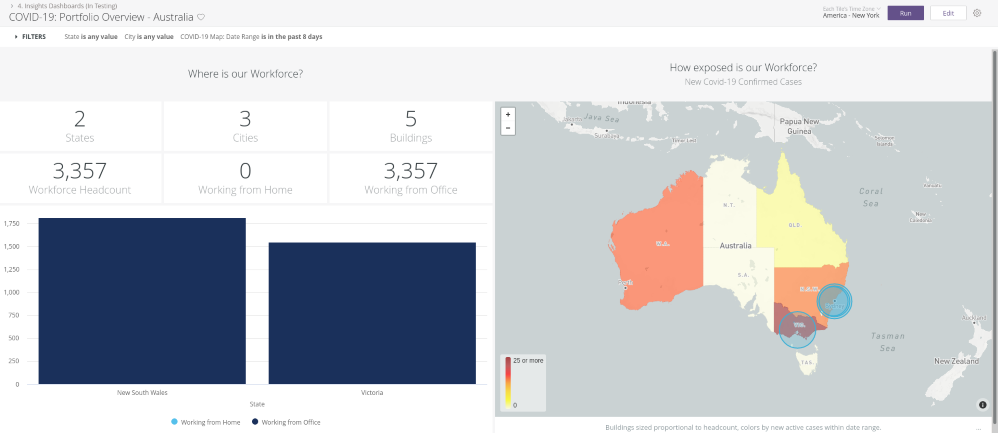
Helps you visualize where your people are and what the relative number of new COVID-19 cases reported has been over the last 7 days. This shows some of the current effect the pandemic has on your organization and may suggest locations you may be able to return to work sooner or later.
This dashboard is similar to COVID-19: Portfolio Overview Dashboard except it is limited to the United States. You can interact with the AU-specific COVID-19 data sets and map data which includes case statistics by state or territory.
Special Data Elements
- Workforce Headcount - Total number of people assigned to a space or team in Serraview.
- Working from Home - Members of the workforce have the "Work From Home" flag set to True in the People Directory and this can be set via Bulk Update Person.
- Working from Office - Members of the workforce have the "Work From Home" flag set to False in the People Directory and this can be set via Bulk Update Person.
Limitations
- The map relies on having accurate longitude and latitude data for each of your building records. For details on how to update your building, refer to Manage a building.
- The map highlights are based on the number of new confirmed COVID-19 cases in the past 7 days.
- This map is limited to the United States and displays county-level COVID-19 data. For global statistics and country-by-country comparisons, see the COVID-19: Portfolio Overview Dashboard.
- To ensure consistency with occupancy figures used to track Work From home and Back To Work activities, this dashboard includes only those buildings managed via Block & Stack (VBS).