Badge Building Essentials Dashboard
Purpose
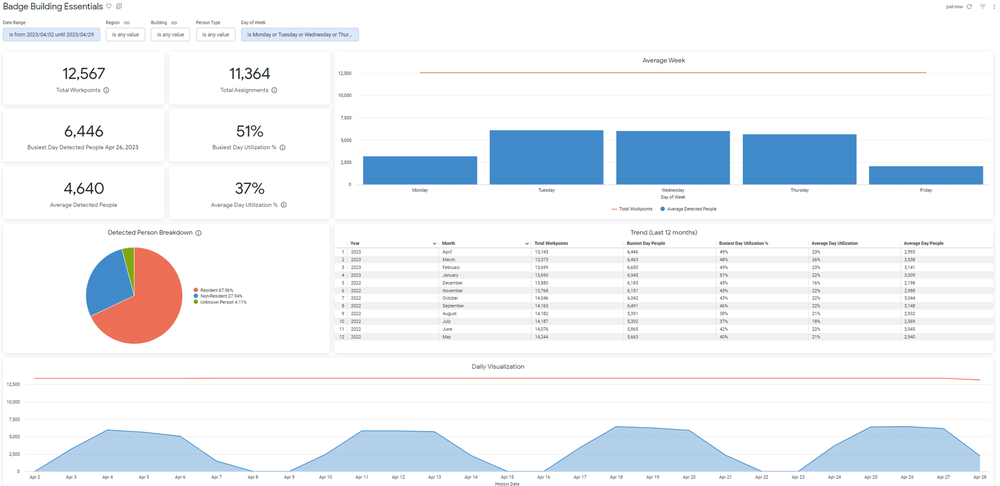
This dashboard provides the most essential information regarding your Badge activity data. How Badge data has been trending, how many attendees each day and how your busiest buildings are performing are included. This provides core utilization information for making strategic decisions and creating informed occupancy plans.
For more filter options and more detailed information regarding your Badge data, see Badge Building Utilization Dashboard.
Special Data Elements
- Busiest Day Utilization % = The count of people on the busiest day divided by total workpoints.
- Average Day Utilization % = The average count of people divided by total workpoints.
- Total Assignments = An occupancy metric, based on the VBS. It is a count of Person Assignments (known as Total People in the Serraview VBS) and Retained (Occupied) workpoints.
Special Filters
- Person Type - this filter lets you control the type of badge person that this data is limited to. The options include Resident, Non-Resident, Visitor and Unknown Person
Limitations
The following tiles cannot be downloaded as a CSV file:
- Trend (Last 12 months)
- Daily Visualization