Portfolio Dashboard Information Panel
This article contains fictional statistics in the examples. If you want to ask questions about your own data then contact the Serraview Support team or your Customer Success Manager (CSM).
As you select options on the left to filter the information, the panels to the right display information matching your selected filter. Below is an example of the Portfolio Dashboard with the floor 27 of 94 Arlowene Street, VIC, Australia selected.
Hover on the image and then click to go directly to the content.
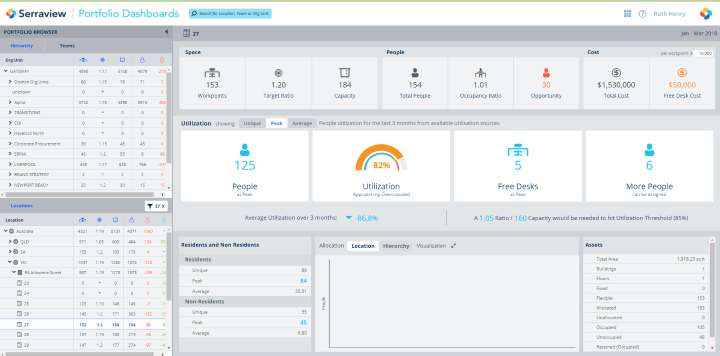
The panels are:
Portfolio Dashboards Browser Panel
- Portfolio Browser Panel contains filters for Hierarchy, Teams and Locations. The filters represent a different way of filtering the data.
Allocation Panel
- Allocation Panel contains information about Space, People and Cost.
Utilization Panel
- Utilization Panel only displays when there is utilization data available for all the floors. For example, if you have selected a building, the Utilization Panel will display only if all the floors of the building have utilization data.
Top Opportunities Panel
- Top Opportunities Panel displays the top opportunities for locations and teams.
Residents and Non-residents Panel
- Residents and Non-residents Panel displays when only when the utilization data is available for all the floors and no Team or Org Unit is selected. For example, if you have selected a building, the panel will display only if all the floors of the building have utilization data. When you select a Team or Org Unit the panel will not display.
Allocation Visualization Panel
- Allocation Visualization Panel contains a bar chart that displays the number of Total People and Workpoints filtered by Location or Org Unit.
Assets Panel
- Assets Panel displays the total area of the portfolio (or the selection of Org Unit and Location), the number of buildings, the number of floors and the number of seats in the portfolio, region or location.