Combined Utilization Summary Dashboard
Purpose
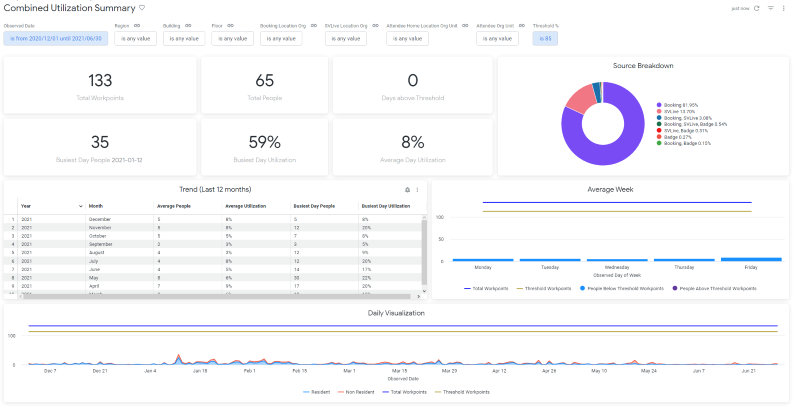
This dashboard shows and combines utilization sources, including Bookings, Badge, and SVLive. This is extremely useful for clients that have multiple data sources, and want to understand what their Utilization is when such data is combined. The way it works is; if a person has appeared in SVLive and Badge, they will only count as 1 person for the purpose of Busiest Day, Average Day, and Daily Visualization. Someone who only appeared in 1 of those sources would also count as 1.
Users can use this combined data to get the most accurate idea of how much space is being used, on what days, and detected via what sources. This informs both strategic decisions and lower-level, smaller-scale moves.
Special Data Elements
-
Busiest Day People = The count Unique count of people across all utilization sources on the day with the most people.
-
Average Day People = The average count Unique count of people across all utilization sources on each day.
Special Filters
- Booking Location Org Unit filter - Filter to only include booked locations with a matching org unit.
-
SVLive Location Org Unit filter - Behavior/effect Filter to only include SVLive locations with a matching org unit.
-
Attendee Home Location Org Unit filter - Filter to only people with a matching home location org unit.
-
Attendee Org Unit filter - Filter to only people with a matching org unit (direct org unit, typically imported from HR system).
Limitations
- Sensors are not included as without PII, it cannot be combined to create person counts.
- When filters include multiple buildings, it is possible for a person to count as a resident to one and non-resident to another. They would therefore count twice.
-
The following tiles cannot be downloaded as a CSV file:
-
Days Above Threshold
-
Busiest Day Utilization
-
Trend (Last 12 Months)
-
Daily Visualization
-