Sensor Provisioning Dashboard
Purpose
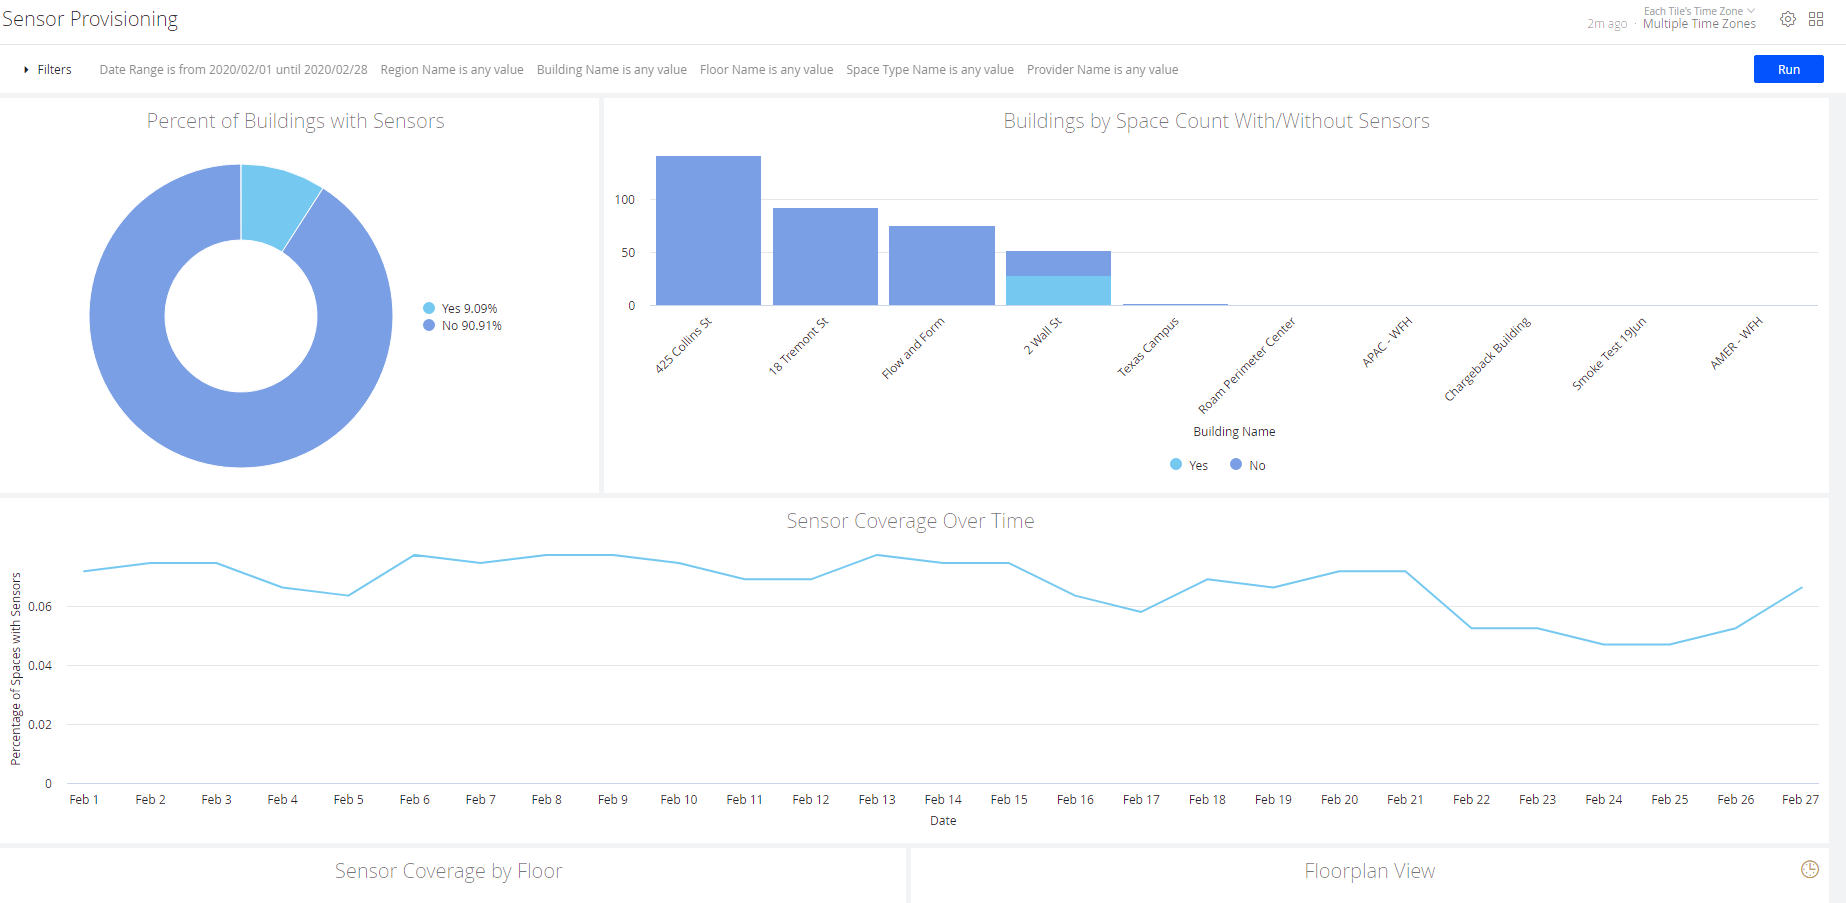
This dashboard identifies where sensor coverage exists for a client, how complete that sensor coverage is, and how sensor coverage has changed over time.
This starts from a building-level overview, clients can see what percentage of buildings have any level of sensor coverage, and what the status is for every space within each building. From there, clients can filter onto specific floors to see a floor plan view of sensor coverage.
A summary table of all spaces with sensors provides detailed information per space and can act as a jumping-off point for cross-filtering.
Special Data Elements
- Has Sensor - The “Yes” or “No” values indicate whether location entities have a sensor activity record within the selected timeframe.
Special Filters
- Provider Name filter - If multiple providers exist and a client wants to filter on a subset or a single value while still including location data of entities without any kind of sensors, they should write “is [desired provider name] OR is null“.
Limitations
Sensor data relies on source data from space sensors, e.g., as provided through the Serraview Sensor Gateway.