Floor and Neighborhood Capacity Calculation
<< View Block and Stack's Information Panel Statistics
A floor's capacity can be a challenge to calculate, especially if a floor has many different aspects e.g. neighborhoods, flexible teams, unallocated space.
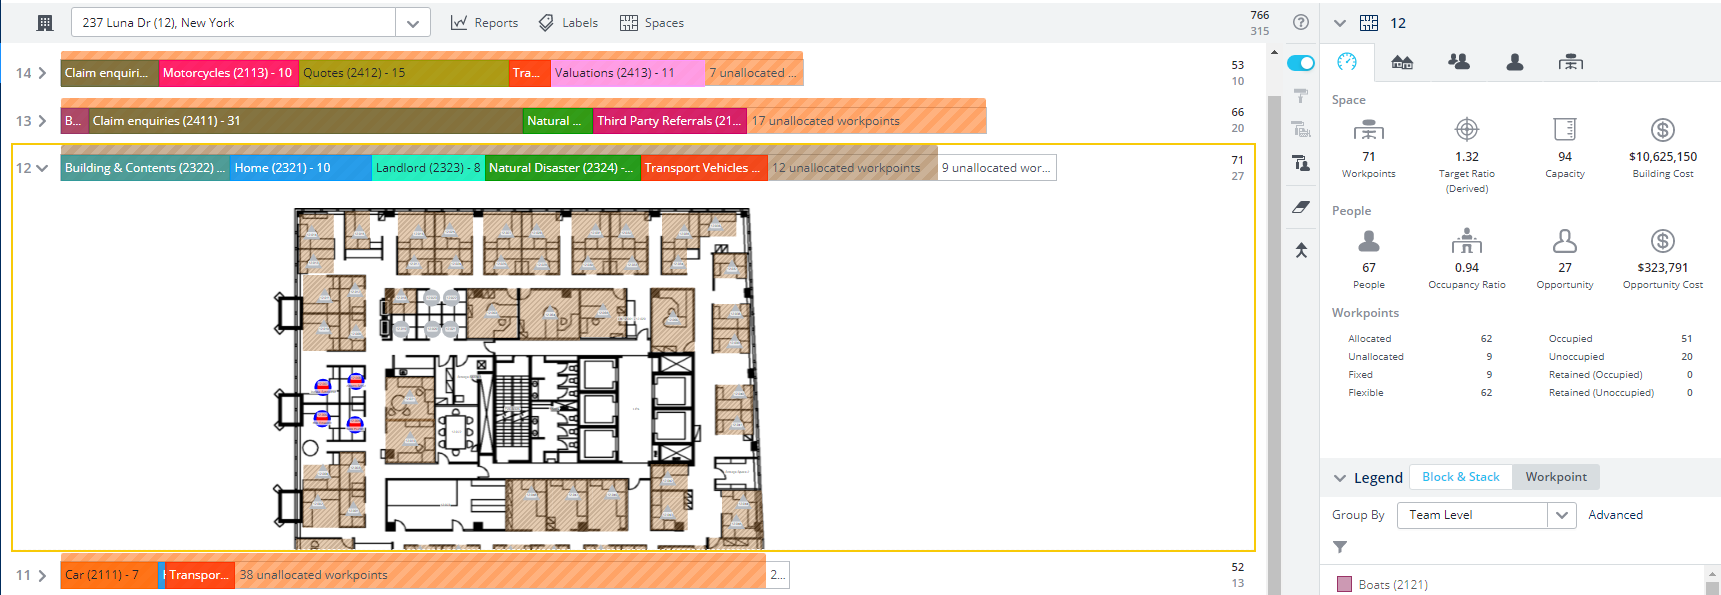
For the floor below the capacity is expected to be the Target Ratio multiplied by the Workpoints which will give you 71 capacity, however the actual capacity is 94. The reason for this is that every team has its own target ratio therefore each team's capacity is calculated individually. Then this is added together to give the total capacity of your selection, for example:
(Team A target ratio X Team A number of workpoints) + (Team B target ratio X Team B number of workpoints) = capacity
Flexi Team and Neighborhood Example
In the example below:
- building's workpoints is 766 and the opportunity is 315.
- building's target ratio is 1.2
- floor's target ratio is 1.2
- each team has a different target ratio
- neighborhood's target ratio is 1.3
To calculate the capacity for this example, the following calculation applies:
|
Team |
Team Target Ratio |
Allocated Workpoints |
Capacity |
Banker's Rounding applied |
|---|---|---|---|---|
|
Building and Contents |
1.2 |
12 |
1.2 x 12 = 14.4 |
14 |
|
Home |
1.2 |
10 |
1.2 x 10 = 12 |
12 |
|
Landlord |
1.2 |
8 |
1.2 x 8 = 9.6 |
10 |
|
Natural Disaster |
1.8 |
11 |
1.8 x 11 = 19.8 |
20 |
|
Transport Vehicles |
1.2 |
9 |
1.2 x 9 = 10.8 |
11 |
|
Neighborhood - Unallocated workpoints |
1.3 |
12 |
1.3 x 12 = 15.6 |
16 |
|
Unallocated workpoints |
1.2 |
9 |
1.2 x 9 = 10.8 |
11 |
|
|
||||
This is using Bankers Rounding after each multiplication. See the Serraview Glossary for the definition.
Unallocated workpoints use the target ratio of the floor or neighborhood that they belong to.
We can see that each team's capacity is calculated individually, based on their target ratio, and that the neighborhood's unallocated workpoints use the neighborhood's target ratio to calculate the capacity. Then add these all together and you get the total of 94 capacity for the floor.
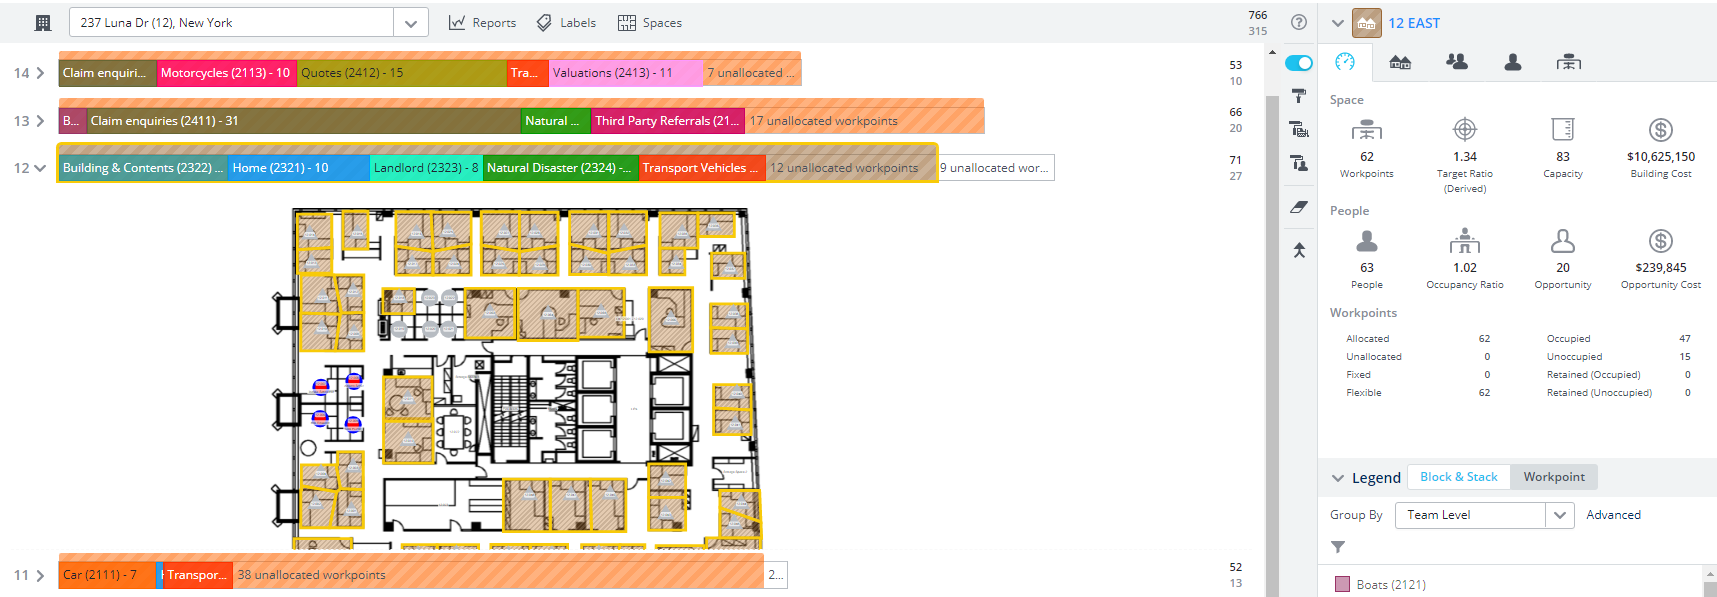
Neighborhood Example
In the example below:
- building's workpoints is 766 and the opportunity is 315.
- building's target ratio is 1.2
- floor's target ratio is 1.2
- each team has a different target ratio
- neighborhood's target ratio is 1.3
To calculate the capacity for this example, the following calculation applies:
|
Team |
Team Target Ratio |
Allocated Workpoints |
Capacity |
Banker's Rounding applied |
|---|---|---|---|---|
|
Building and Contents |
1.2 |
12 |
1.2 x 12 = 14.4 |
14 |
|
Home |
1.2 |
10 |
1.2 x 10 = 12 |
12 |
|
Landlord |
1.2 |
8 |
1.2 x 8 = 9.6 |
10 |
|
Natural Disaster |
1.8 |
11 |
1.8 x 11 = 19.8 |
20 |
|
Transport Vehicles |
1.2 |
9 |
1.2 x 9 = 10.8 |
11 |
|
Neighborhood - Unallocated workpoints |
1.3 |
12 |
1.3 x 12 = 15.6 |
16 |
|
|
||||
This is using Bankers Rounding after each multiplication.
Unallocated workpoints use the target ratio of the floor or neighborhood that they belong to.
We can see that each team's capacity is calculated individually, based on their target ratio, and that the neighborhood's unallocated workpoints use the neighborhood's target ratio to calculate the capacity. Then add these all together and you get the total of 83 capacity for the neighborhood.