Service Request Summary Dashboard
Purpose
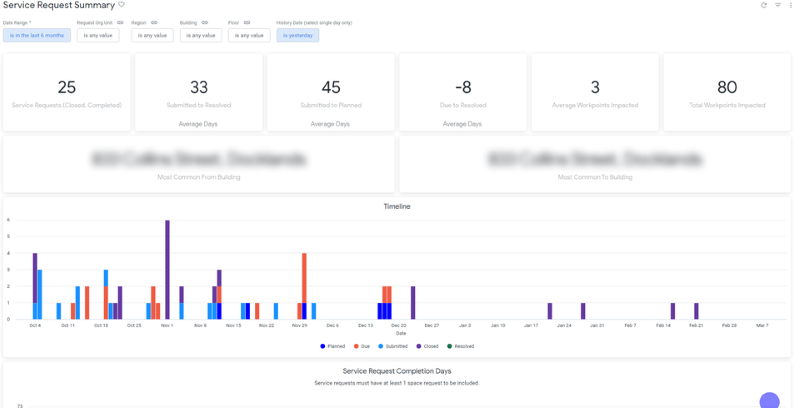
The Service Request Summary dashboard provides a top-down summary of how service requests have been progressing within the time range. Information like how many days to complete or planned, what type of service request, and which org units are creating these requests is included. This information can arm strategic decisions, validate KPIs, and identify trends. The scatter plot Service Request Completion Days shows how long Service requests take for how many workpoints, colored by type. The size of the circle indicates how many service requests there were. Service requests without any space requests are not included.
Special Data Elements
Average Days - Submitted to Resolved = The average number of days between Submitted dates (the date a service request was created) and Resolved Dates (Resolved Date is also known as Completed Date).
Average Days - Submitted to Planned = The average number of days between Submitted and Planned dates.
Average Days - Due to Resolved = The average number of days between Due and Resolved dates. Negative values indicate it was, on average, resolved before it was due. (Resolved Date is also known as Completed Date).
Special Filters
- History Date filter - The date for which it gets the service request state. Important Note - We recommended you leave this set to Yesterday.
Date Range filter - The scan range for service requests, checks against all date values a service request has.
Limitations
- Only Service Requests that are closed or completed appear in this dashboard.