Portfolio Overview Dashboard
Purpose
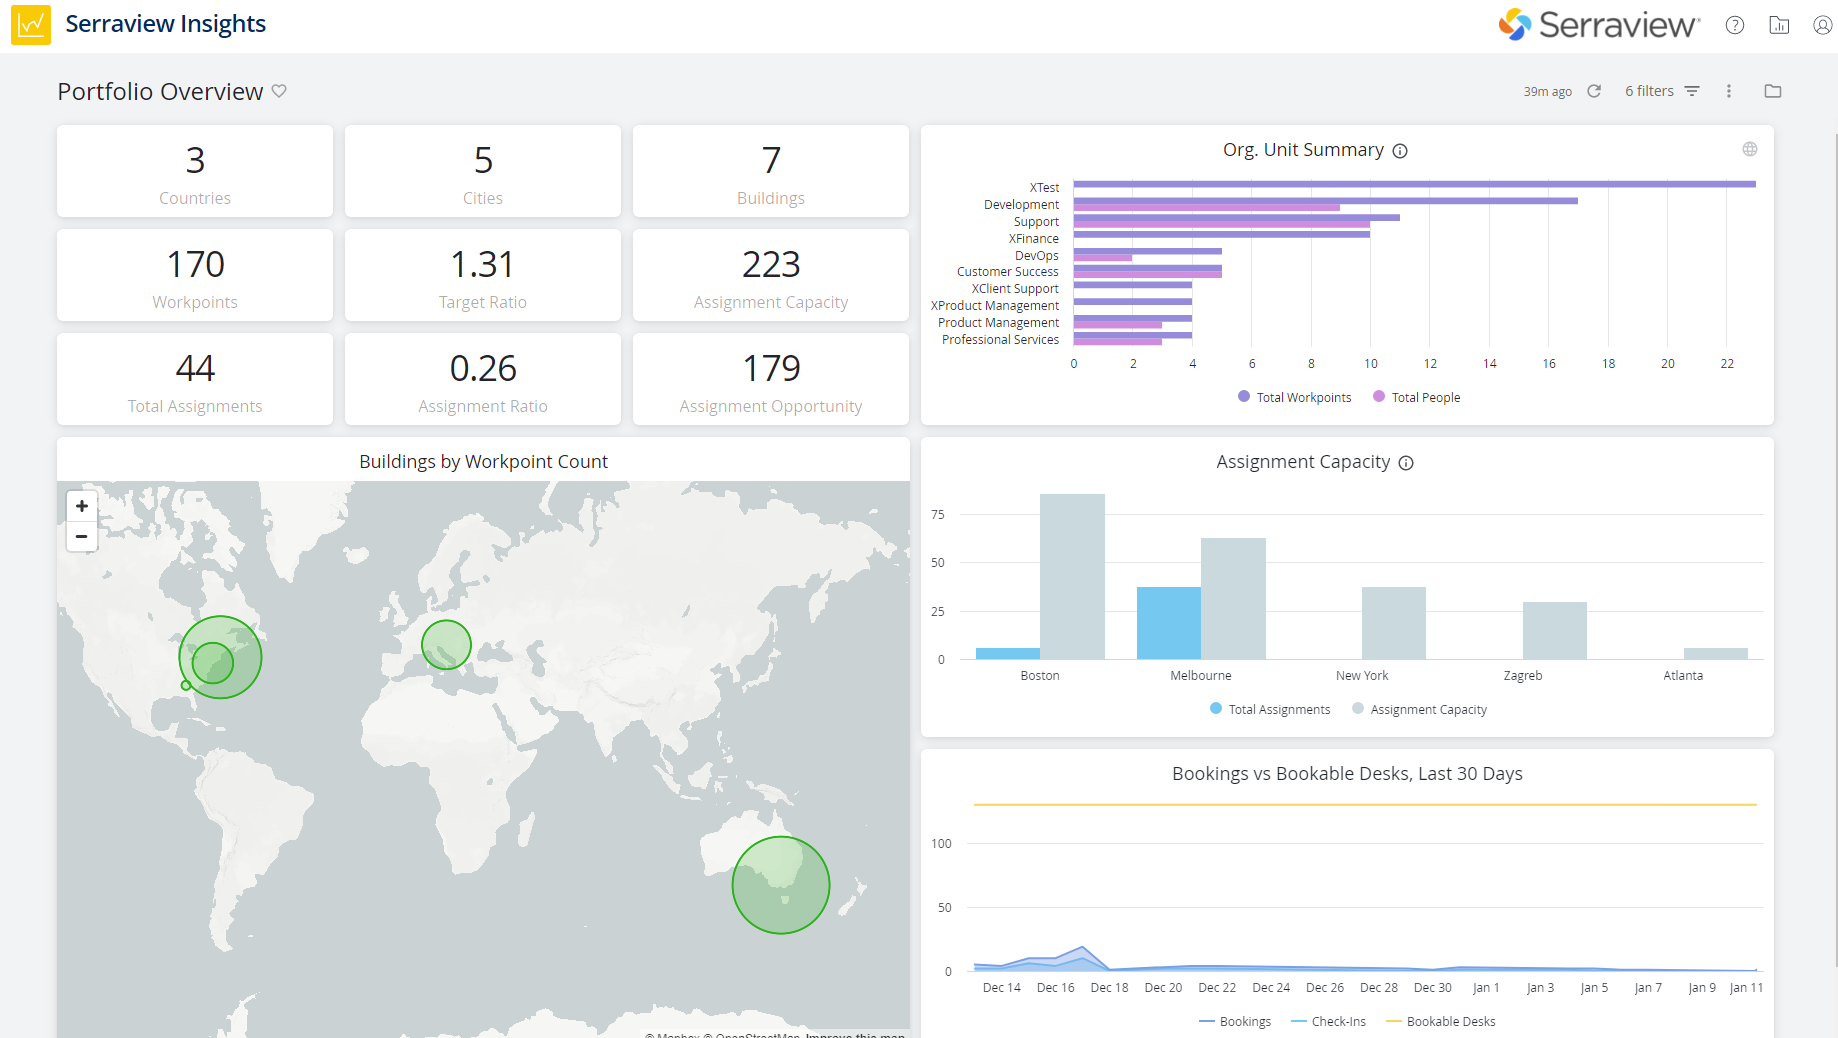
Gives you insights into your workplace capacity and headcount.
Special Data Elements
- Org Unit Summary - Top 10 organizational units, ordered by workpoint count. The number of workpoints is based on stated capacity, which may exceed the number of physical locations in the case of shared spaces.
- Assignment Capacity - Top 15 cites, ordered by assignment capacity. The number of workpoints is based on stated capacity, which may exceed the number of physical locations in the case of shared spaces. Assignment counts include only known persons and not retained spaces.
- Filters - By default the filters are hidden. Click the Filters
 icon to display the filter panel.
 - Buildings by Workpoint Count - The visualization does not display buildings with 0 workpoints, unless ALL of the buildings in the selection have 0 workpoints.
- Map Markers - The marker sizes on the map are proportional to the number of workpoints for each indicated building.
Special Drill Downs
- Click on the metrics, locations on the map, or columns in the chart to see the drill down data.
Limitations
- The Map of the World relies on having accurate longitude and latitude data for each of your building records. For details on how to update your building, refer to Add, Edit, or Delete a Building.
- The following tiles cannot be downloaded as a CSV file:
-
Bookings vs Bookable Desks, Last 30 Days
-