Density and Occupancy Dashboard
Purpose
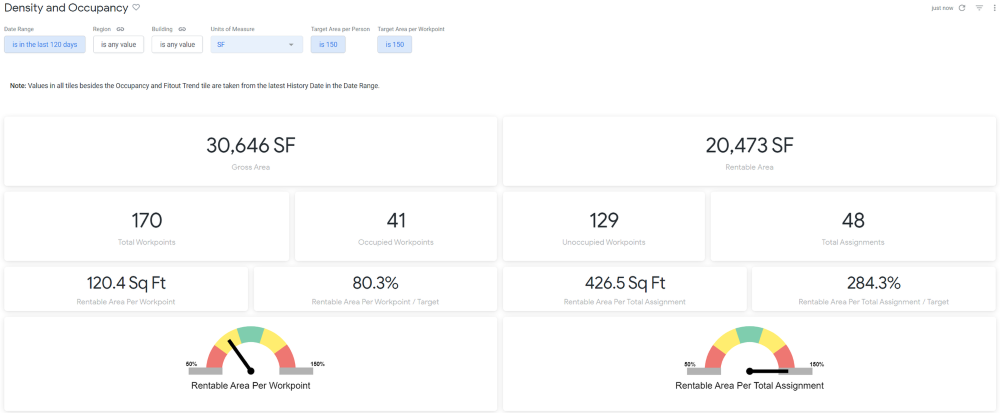
This dashboard shows how occupancy and fit-out currently are and how they have trended. This information can assist with compliance or executive level reporting and allows the selection of Target Area Per Workpoint/Assignment for that purpose.
The Occupancy and Fitout Trend tile shows how Rentable Area per Workpoint/Assignment has changed over time, as compared to your occupancy %. This trend shows how changes to the portfolio have impacted the fit-out, and assists with tracking against success criteria.
Special Data Elements
-
All single value metrics use the latest date in the ‘Date Range’ parameter.
-
Rentable Area Per Workpoint dial = Shows, by %, how close to the Target Area Per Workpoint the Rentable Area Per Workpoint is.
-
Rentable Area Per Assignment dial = Shows, by %, how close to the Target Area Per Assignment the Rentable Area Per Assignment is.
-
Trend (Assignment Ratio) = The change in Assignment ratio from the first date in the Date Range filter to the latest date in the Date Range.
-
Trend (Rentable Area Per Workpoint/Total Assignment) = The change in area from the first date in the Date Range filter to the latest date in the Date Range.
Special Filters
- Target Area Per Workpoint/Assignment filter - controls the % and dials for Rentable Area Per Workpoint/Assignment
Limitations
-
All single value metrics use the latest date in the ‘Date Range’ parameter.
-
Trend columns in the Details tile compare the first date in the Date Range filter to the latest date.