SVLive Troubleshooting Floorplan Dashboard
Purpose
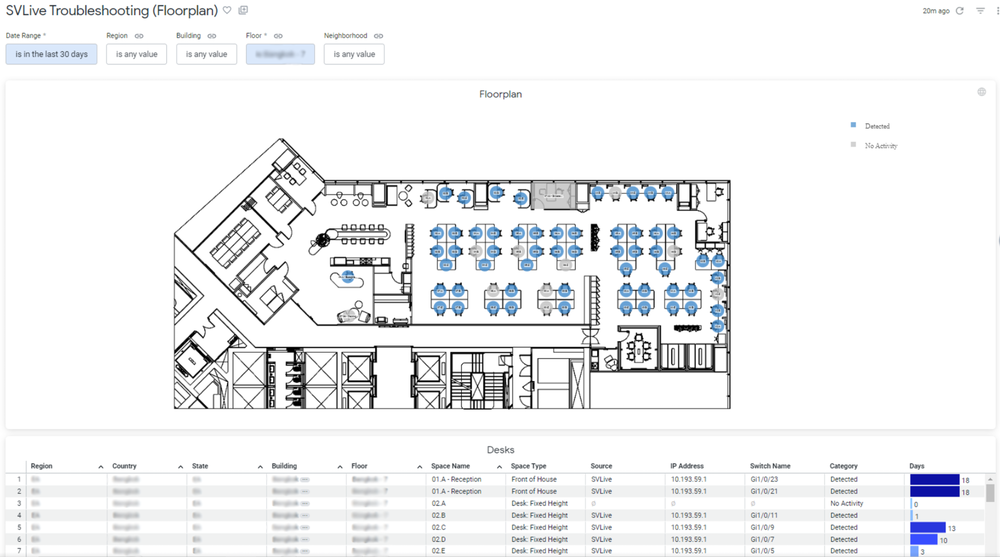
This dashboard provides a quick, graphical representation of SVLive wired activity to help users quickly identify and locate any desks with data reporting issues.
Activity appears on a map of a selected floor with desks marked in a grey color if they have had no wired SVLive activity within the selected date range, blue where there was activity. Below the floor plan appears a table of the desks shown on the floor and the last time they had activity.
This single-floor dashboard is separate from the existing, comprehensive SVLive troubleshooting report so users have the opportunity to schedule a single floor plan to be automatically delivered when designated criteria are met (e.g., at end of month for all desks with no activity in the past 30 days).
Limitations
- This report focuses on activity specific to individual desks and, as such, pertains only to ‘wired’ SVLive data, not WiFi based presence detection.