Allocation Visualization Panel
Location Tab
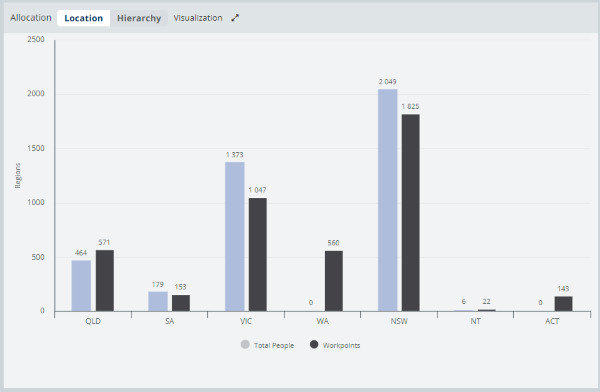
The example below displays the data for the location Australia.
|
Chart |
Description |
|---|---|
|
Bar chart |
The bar chart displays two columns Total People and Workpoints. You can filter by Location or by Org Unit. |
Hierarchy Tab
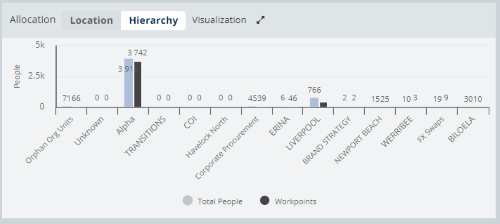
The Hierarchy tab will not filter on Org Unit or a location as this is due to performance reasons.
The example below displays the data for floor 27 of 94 Arlowene Street, VIC, Australia.
|
Chart |
Description |
|---|---|
|
Bar chart |
The bar chart displays two columns Total People and Workpoints. You can filter by Location or by Org Unit. |
Breakdown
You can click the Visualization ![]() icon to display expand the sized of the chart.
icon to display expand the sized of the chart.
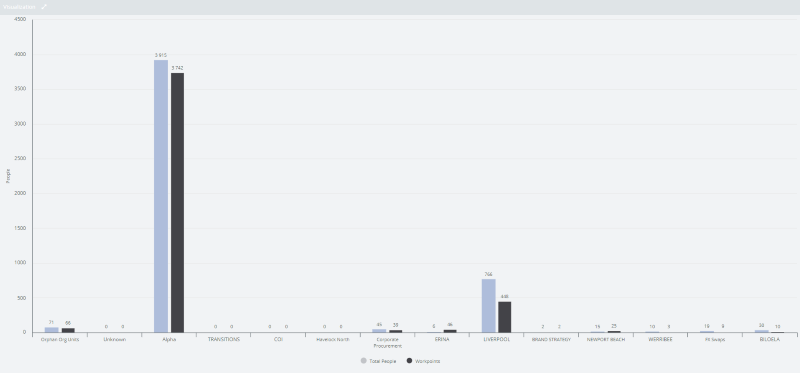
Also, you can click the breakdown ![]() icon to close the chart.
icon to close the chart.