Space Type Summary Dashboard
Purpose
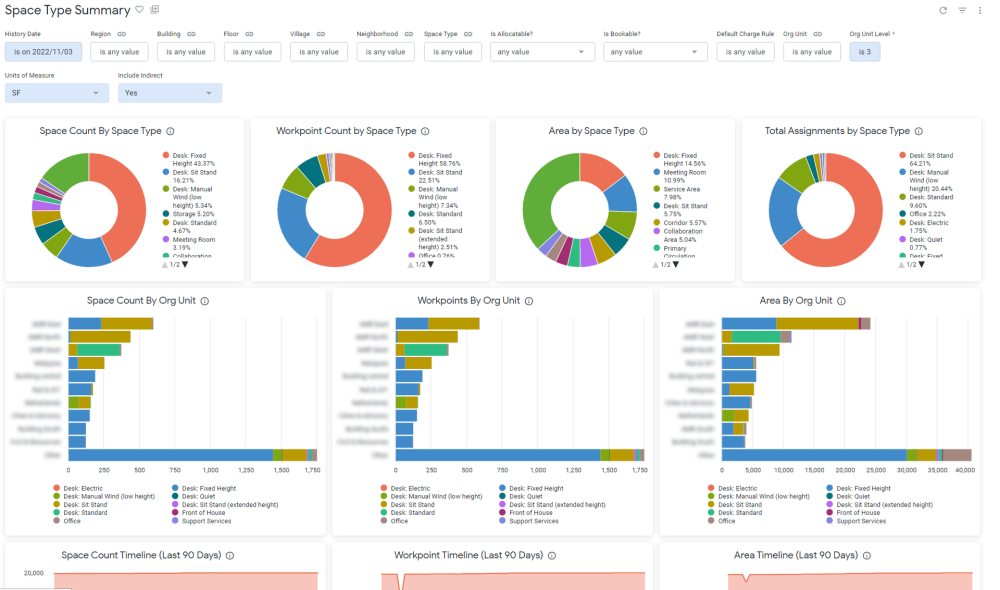
This advanced dashboard provides a comprehensive breakdown of space types and it uses the Baseline Metrics. These metrics all have the same meanings as previously, but are calculated in new ways that allow for greater flexibility. This allows you to start at the portfolio level and go right down to a team level and see how their spaces, workpoints and area breaks down by space types.
Timelines are included to help you understand how these values have changed over time, and full information on all space types is included at the bottom for precise data as needed. All of this information can inform planning, identify patterns and track against success metrics.
Special Data Elements
- All metrics use Baseline Metric and which are a new way of calculating the same values.
Special Filters
- Include Indirect? - Baseline metrics can now associate spaces with flexible teams inside of neighborhoods. This association is indirect - the team is not allocated any spaces, but they are allocated a portion of the neighborhood stack. We use this to portion metrics from those spaces to those teams. This behaviour can be turned off by setting this filter to No.
Limitations
- N/A