Color By in the VBS Legend
Color By provides a way to quickly visualize information through the use of coloring options, available in the VBS. The Color By drop-down in the legend controls the coloring of the Teams and Org Units on the stack. It is useful for statistical analysis of multiple teams as it places all like-colored items together.
You can change the Color By to display by:
- Org Unit
- Actual versus Target Ratio
- Fixed versus Flexible Teams
- Validation
- Utilization
Org Unit
This option colors by teams and org unit levels.
- In the Legend panel, click the Advanced button.
- From the Group By drop-down, select either the Team Level or the Org Unit Level.
- From the Color By drop-drown, select Org Unit.
The color is consistent, therefore an org unit that displays red in one building in the VBS will be red every time the org unit appears in any other building or floor in VBS, in Scenario Planner, and in reports.
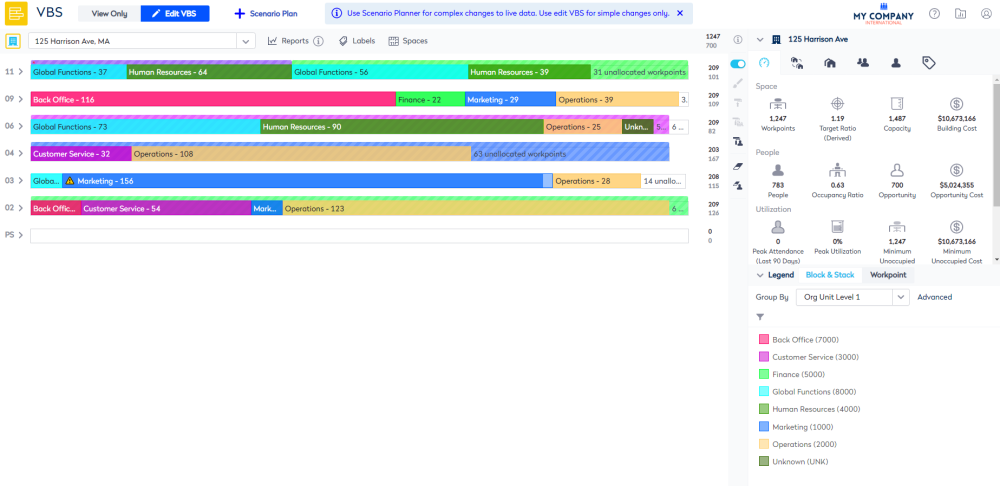
In the example below, the Group By was selected for Org Unit Level 1 and the Color By was selected for Org Unit.
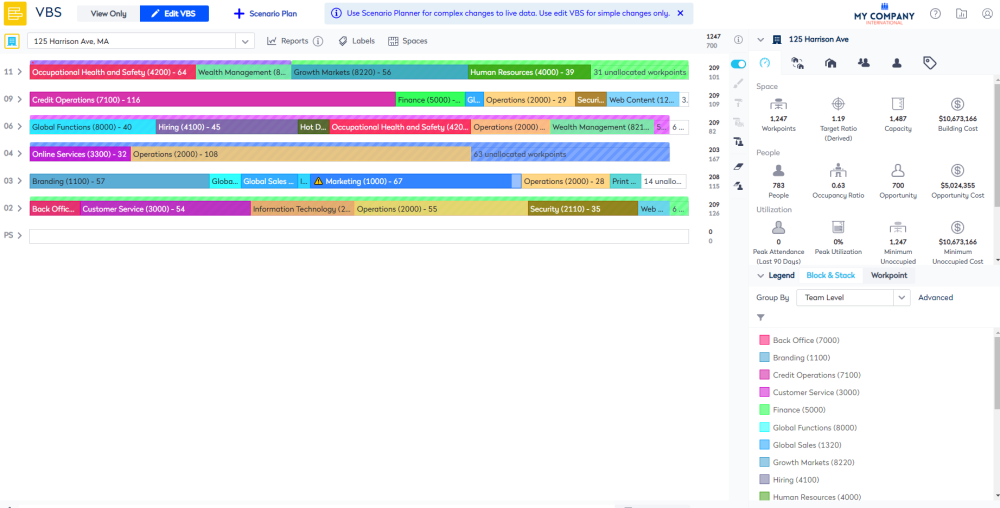
The example below the Group By was selected for Team Level and the Color By was selected for Org Unit.
Actual versus Target Ratio
This option compares a team's occupancy (actual) with its target ratio. The default bands are:
- Below Target Ratio
- At Target Ratio
- Above Target Ratio
Target Ratio for a single team
You can see the Target Ratio and Occupancy Ratio for a team.
- In the Legend panel, click the Advanced button.
- From the Group By drop-down, select Team Level or the Org Unit Level.
- From the Color By drop-down, select Actual Versus Target Ratio.
- On the stack, select the team.
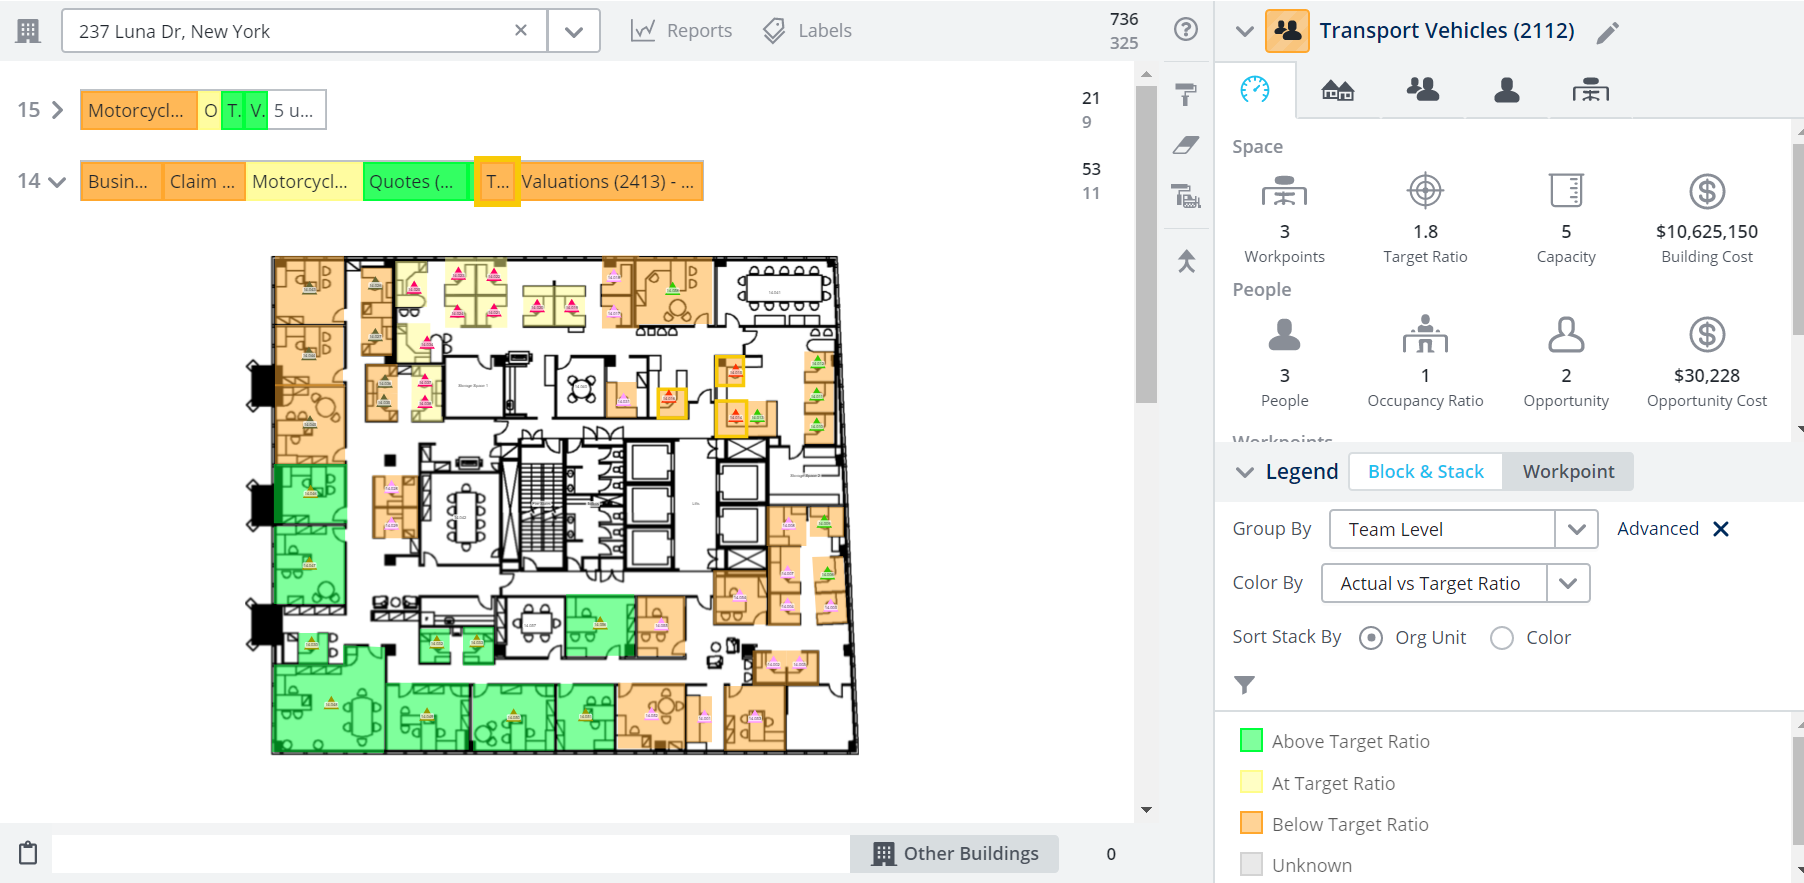
In the example below, the Quotes team is selected and in the Information Panel the Target Ratio is 1.8 and the Occupancy Ratio is 1 because their Occupancy Ratio is below their Target Ratio, they show as Below Target Ratio.
Target Ratio for multiple teams
You can view which teams are below, above or at their target ratio.
- In the Legend panel, click the Advanced button.
- From the Group By drop-down, select Team Level or the Org Unit Level.
- From the Color By drop-down, select Actual Versus Target Ratio.
- On the stack, select either the:
- team(s) - Hold the Ctrl key + click the different teams to select multiple teams. You can also, hold the Shift key and click the first team and then click the last team which will select all teams between those two points.
- nieghborhood(s) - Hold the Ctrl key + click the different neighborhoods to select multiple neighborhoods. You can also, hold the Shift key and click the first neighborhood and then click the last neighborhood which will select all teams between those two points.
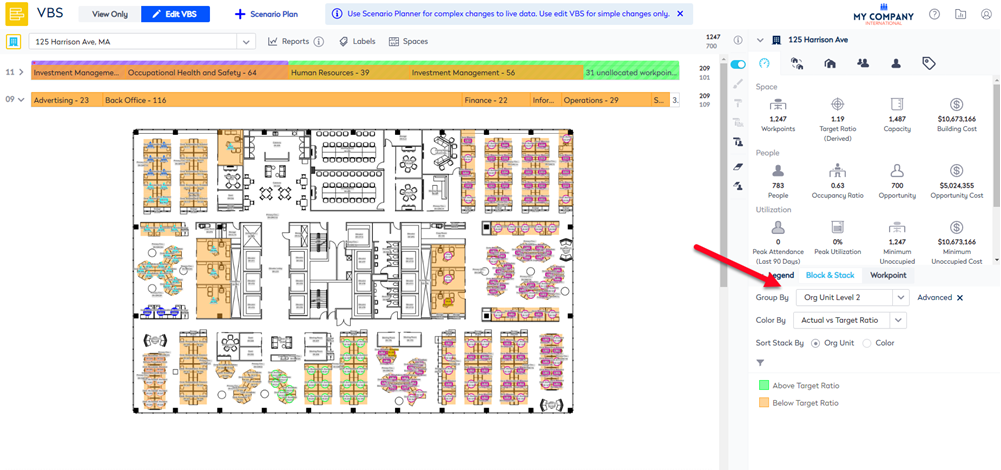
In the example below, the Group By was selected for Org Unit Level 2 and the Color By was selected for Actual vs Target Ratio.
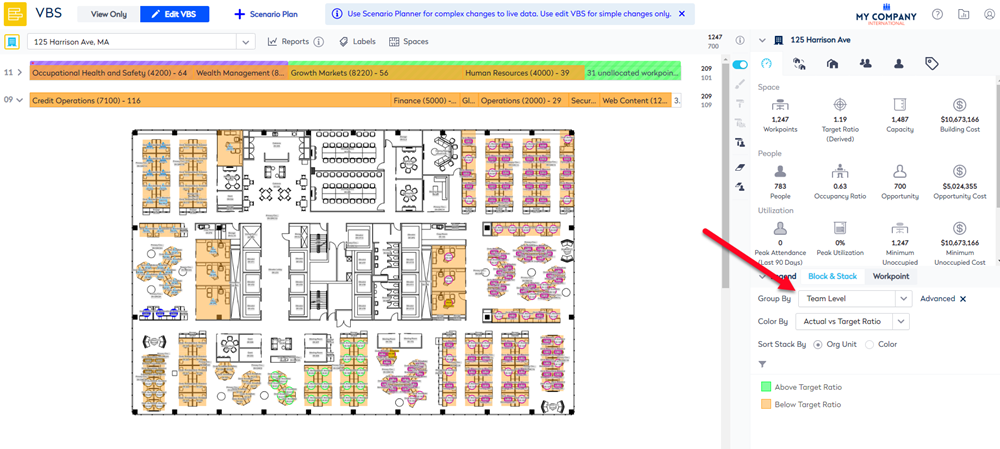
In the example below, the Group By was selected for Team Level and the Color By was selected for Actual vs Target Ratio.
Fixed versus Flexible Teams
This option colors by teams and org unit levels.
- In the Legend panel, click the Advanced button.
- From the Group By drop-down, select either the Team Level or the Org Unit Level.
- From the Color By drop-drown, select Fixed vs Flexi Teams.
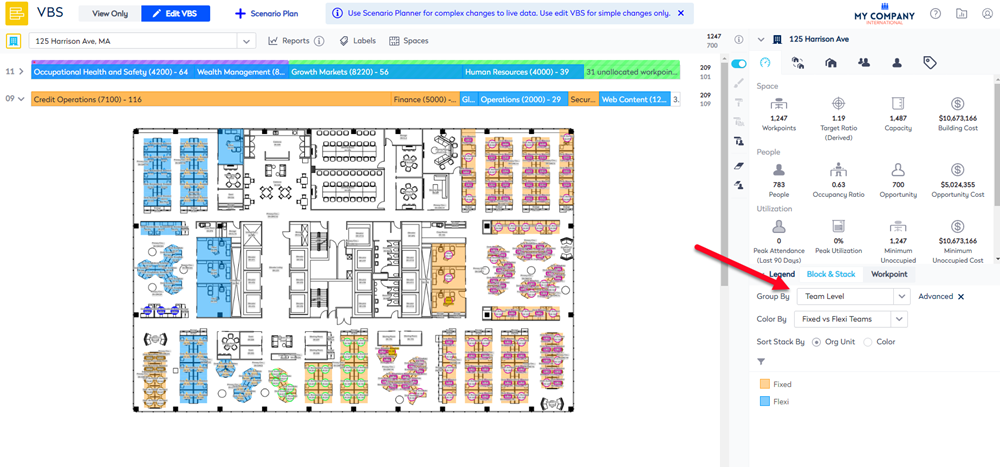
In the example below, the Group By was selected for Team Level and the Color By was selected for Fixed vs Flexi Teams. At a Team Level, orange teams are Fixed Teams, and blue teams are Flexible Teams.
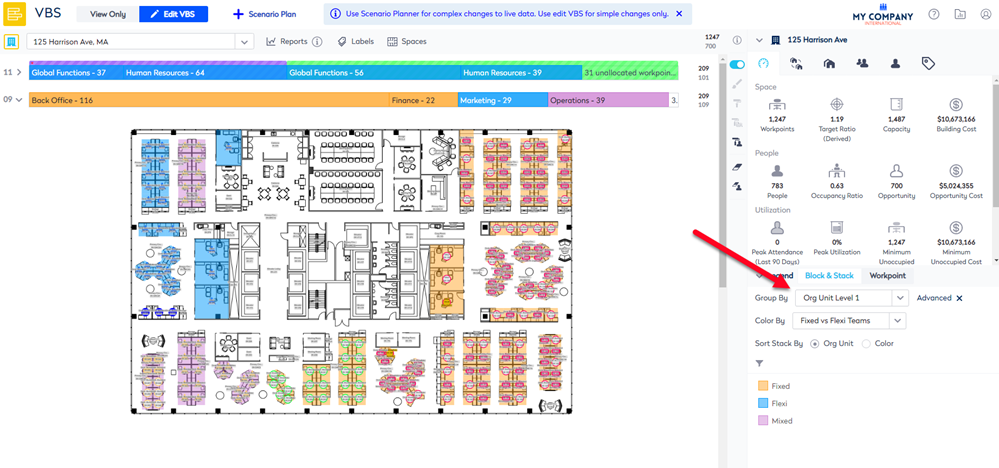
In the example below, displays floors with either Fixed Teams (orange), Flexible Team (blue) or a combination (purple). At higher Org Unit levels, where all teams belonging to the org unit have the same fixed or flexible status, the corresponding fixed or flexible color is applied to the org unit. If the org unit contains a combination of fixed and flexible teams, the "mixed" color is applied to the org unit.
Validation
This option colors by teams and org unit levels.
- In the Legend panel, click the Advanced button.
- From the Group By drop-down, select either the Team Level or Org Unit Level.
- From the Color By drop-drown, select Validation.
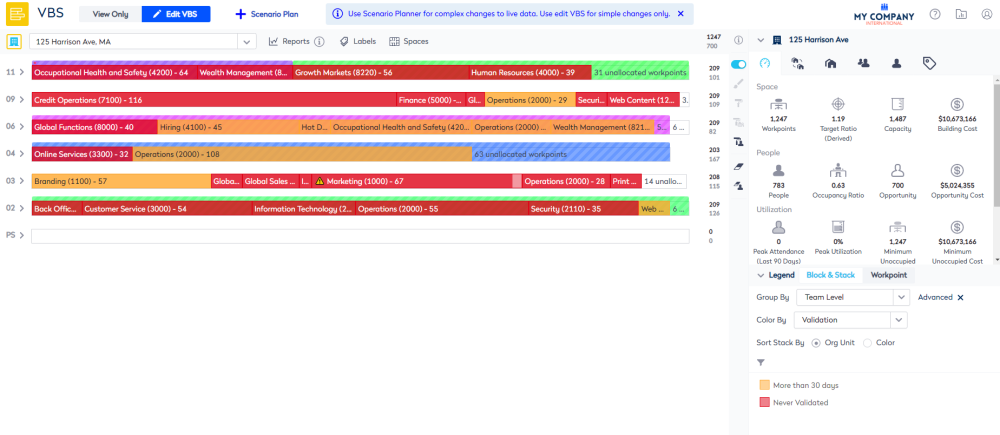
In the example below, the Group By was selected for Team Level and the Color By was selected for Validation. The option colors teams based on when they were last validated in Workplace. The default bands are:
- More than 30 days
- Never Validated
Utilization
The Utilization option colors the teams based on their peak utilization ratio (peak utilization divided by total workpoints). The utilization statistics are based on Badge Swipe data or SVLive data. If you do not have Badge Swipe data or SVLive data within your portfolio you will not see these statistics at all or the statistics will display a zero count.
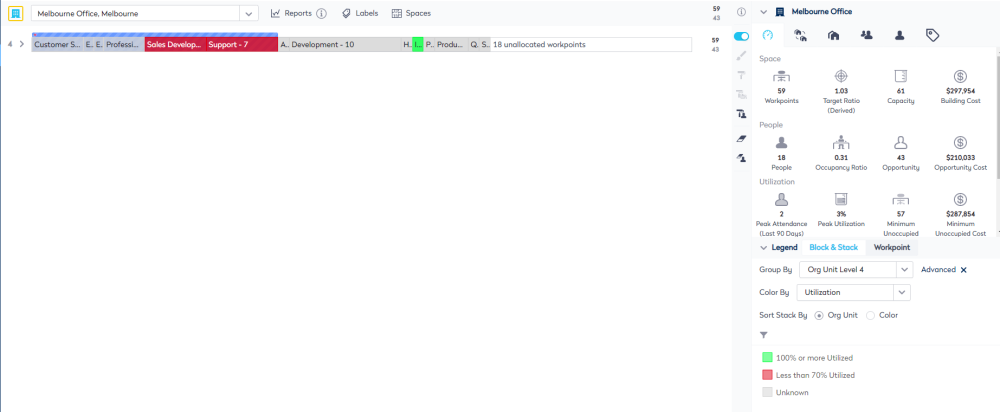
In the example below, the Group By was selected for Team Level and Color By was selected for Utilization. The default bands are:
- 100% (or more) utilized
- 90% or more utilized
- 80% or more utilized
- 70% or more utilized
- Less than 70%
- Unknown
The default is set at the portfolio level in the Configure Utilization for VBS - Information Panel settings and if needed this can be overridden on a per building basis in the Building Utilization Provider setting, refer to Manage a building.