Organization Unit Overview Dashboard
Purpose
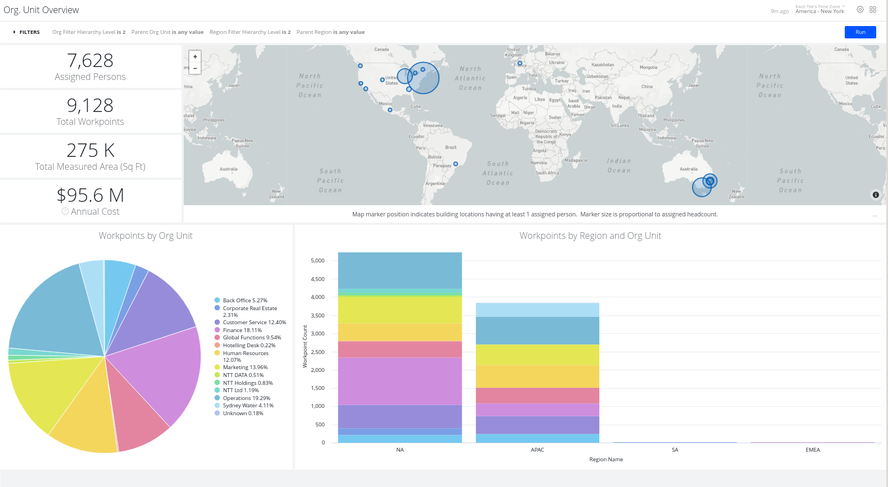
This dashboard supports Space Planners' conversations with business line owners by summarizing key metrics by org unit and region. It answers questions including:
- How much space do I have? Who’s using how much of it and where?
- What does it cost? Why?
In the event of questions about details, dashboard users can click on a metric or chart segment of interest and explore underlying records.
Special Data Elements
-
Assigned People Count - The sum of all people assigned to teams or workpoints allocated in the filtered locations.
-
Total Workpoints - The sum of all workpoints allocated to teams within the dashboard’s filter settings.
Special Filters
-
Org / Region Filter Hierarchy Level filters - These filters restrict the list of organization units / regions visible in their respective drop-down lists.
-
Parent Org. Unit / Parent Region filter - This filters the dashboard to show workpoints and organization totals that fall under the scope of the selected organization unit and/or region.
-
Default filter - The dashboard loads by default showing a breakout of workpoints by the second level of organization and region hierarchies, that is, one level beneath the ‘root node’. You may change the display to other levels (higher or lower) via the filter controls.
Limitations
-
Some of the metrics in this dashboard, like annual cost and total measured area, assume cost and area values have been entered in Serraview.
-
The following tiles cannot be downloaded as a CSV file:
-
Workpoints by Region and Org Unit
-