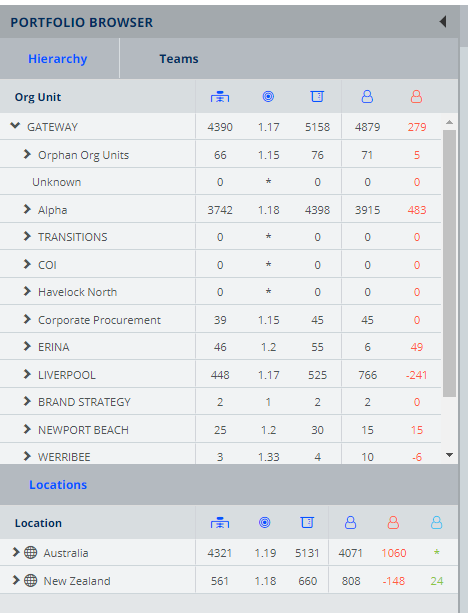
Portfolio Browser Panel
- Hierarchy: All business within the portfolio, with their corresponding Org Units and their teams in a drill-down format.
- Teams: Alphabetically listed team names across the portfolio.
- Locations: All offices within the portfolio, drilled-down by country, state through to floor.
Click a row in any of these tabs will apply the filter and update the view (Portfolio Dashboard Information Panels) to the right of the screen.
View/Filter by Hierarchy
The Hierarchy section allows you to filter the information not only at Team level, but at any level within the Org Unit Hierarchy.
For example the image below displays the Corporate Procurement selected, so the Corporate Procurement filter is applied and Corporate Procurement label displays in the filter on the top-left. Click the filter label ![]() to remove the filter.
to remove the filter.
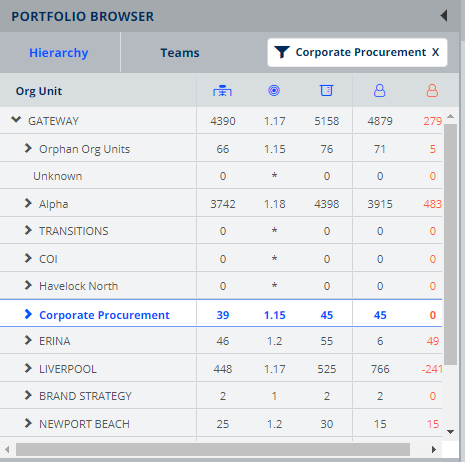
You can use the toggles to the left of each Org Unit or team name to expand or collapse the visible information.
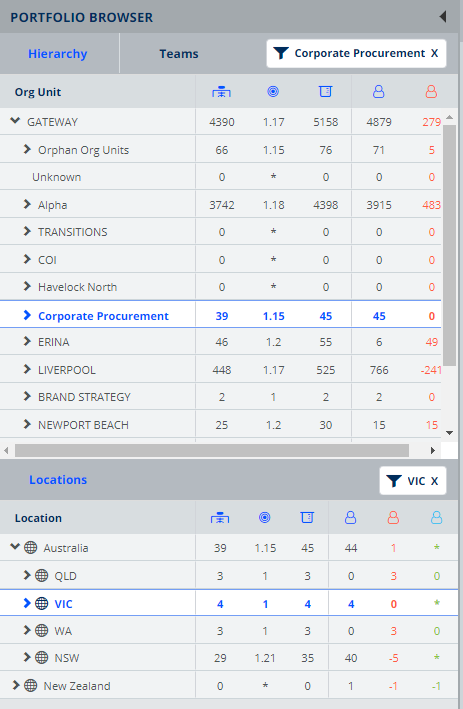
View/Filter by Location
The Locations tab allows you to navigate geographically using the toggles at the left to expand or collapse the various regions within your portfolio and aggregate information as required. The Locations section works in combination with the Hierarchy section, allowing you to filter on both simultaneously.
For example the image below displays we have filtered for Corporate Procurement (from the Hierarchy tab) and then added a filter to displays Victoria. Click the filter label ![]() to remove the filter.
to remove the filter.
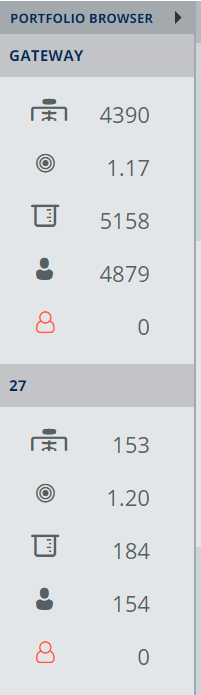
View by Team
The Team section contains a list of all the teams in the portfolio, including a sum of the total number of teams, plus the number of teams under and over capacity (based on the occupancy of the teams and the team ratios).
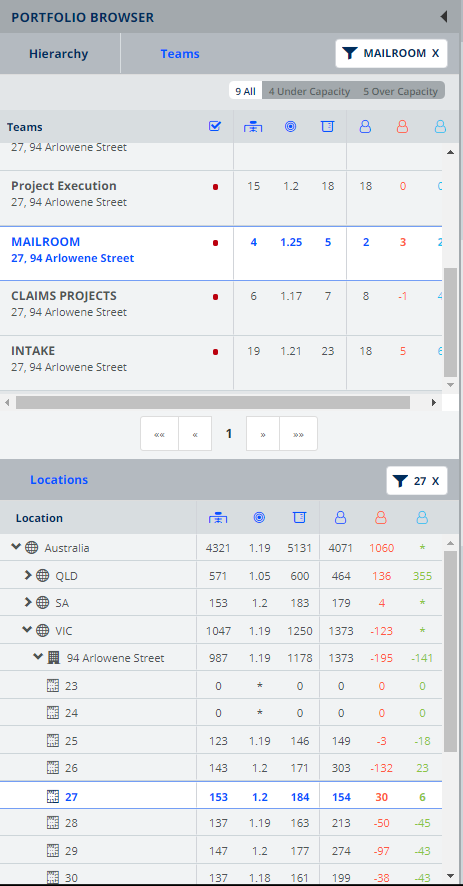
For each team on the left-hand panel the following columns display:
|
Icon & Example |
Description |
|---|---|
|
|
Indicates if the team has been validated recently, with an easy to read traffic-light system displaying where teams require validation.
|
|
|
The total number of workpoints. |
|
|
The derived preferred ratio of people to workpoints. The calculation is capacity divided by total workpoints. |
|
|
Capacity is the sum of team capacity, which is the number of workpoints multiple by the team's target ratio. |
|
|
People is the number of people assigned. |
|
|
Opportunity is the capacity minus the number of assigned people and retained desks. |
|
|
The amount of people that can be assigned to attain 100% utilization. |
Expand or Collapse the View/Filter Panel
You can expand or collapse the panel.
- Click the Collapse
 icon to condense the view.
- Click the Expand
 icon to display the View/Filter Panel.