Monitor and Adjust
Ensure your employees are safe and be quick to adjust
Consider the questions in the following checklists when monitoring the situation and then deciding on the adjustments.
Monitor Checklist
- How many people are coming into the office?
- What are our safe working metrics?
- Are we exceeding safe thresholds (including access and exit points of the property)?
- Are people adhering space protocols and off-limit spaces?
- Has there been a rise in new cases reported in the region?
- Has anyone reported a possible contamination?
- Are staff realizing value by being in the office vs WFH?
Adjust and Execute Checklist
- Inform employees of new policies and procedures
- Evacuation protocols and delivery methods
- Contamination protocols
- Contact tracing methods and communication protocols
- Adjust work from home status per employee
- How is employee sentiment trending (more/less comfortable)?
- Report to management
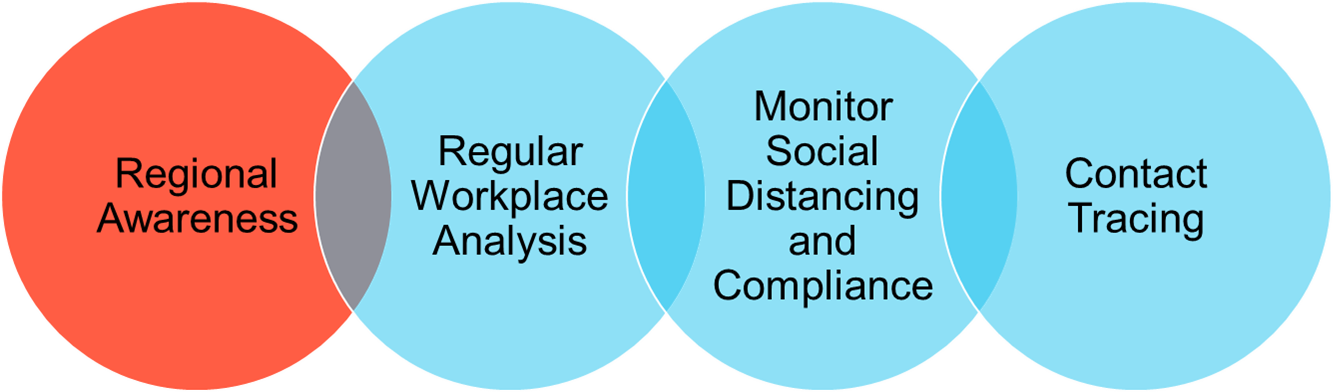
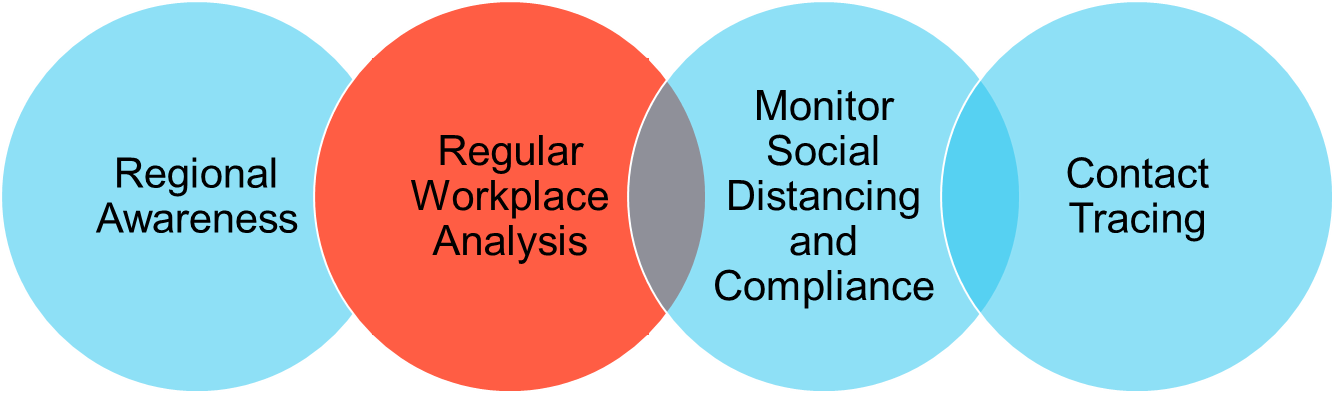
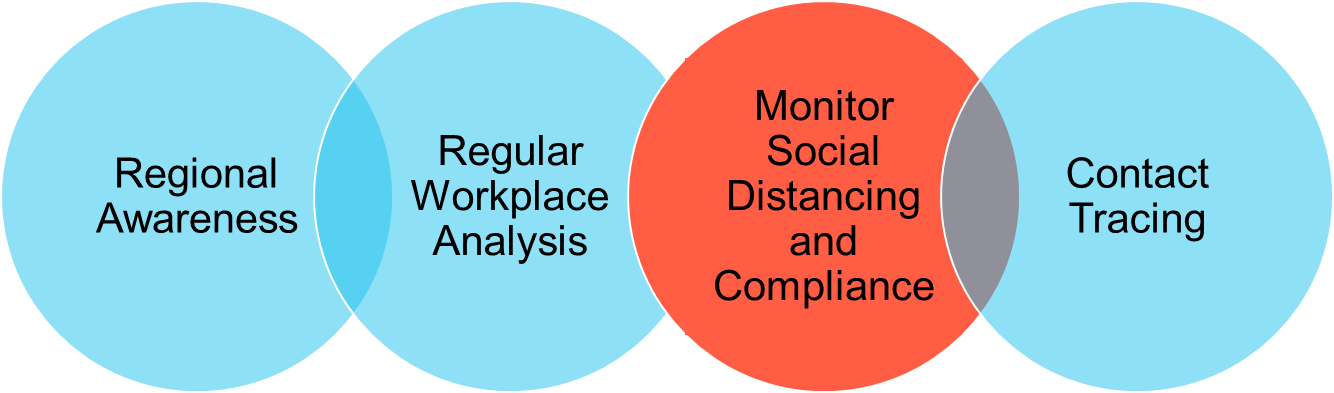
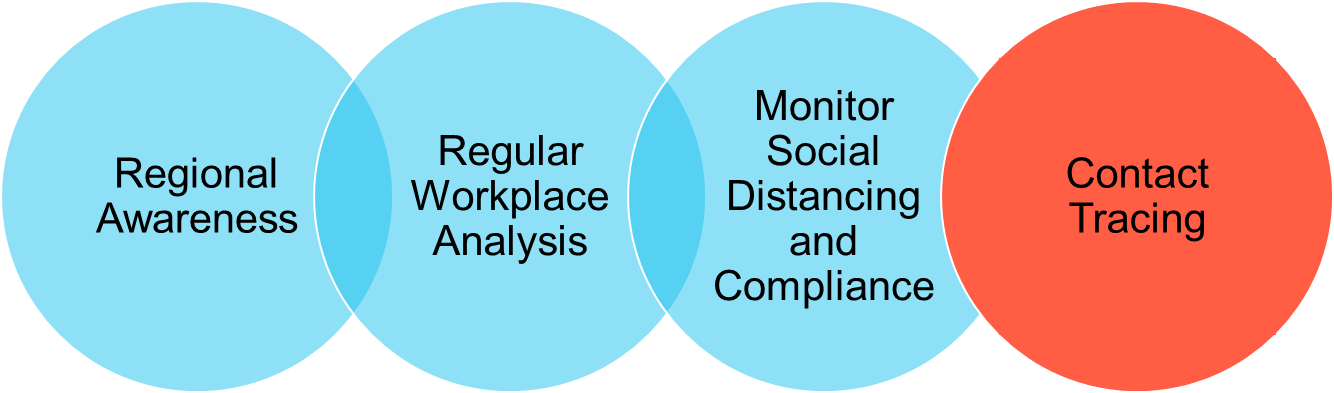
With the checklists in mind, you can use Serraview to assist with:
- Regional Awareness
- Regular Workplace Analysis
- Monitor Social Distancing and Compliance
- Contact Tracing
Remember to check your Employee Sentiment
When needed you can use the micro-survey to ask your employees questions to find out when they are working from home and/or find out your employee sentiment. Find out more in Complete an Employee Audit using Micro-survey.
Region Awareness
Keep your focus on the latest COVID-19 information from your local or national Health Department's website. Also, the Regional Conditions from the Insights Dashboards.
Insight Dashboards
Below lists the dashboards for the latest COVID-19 information.
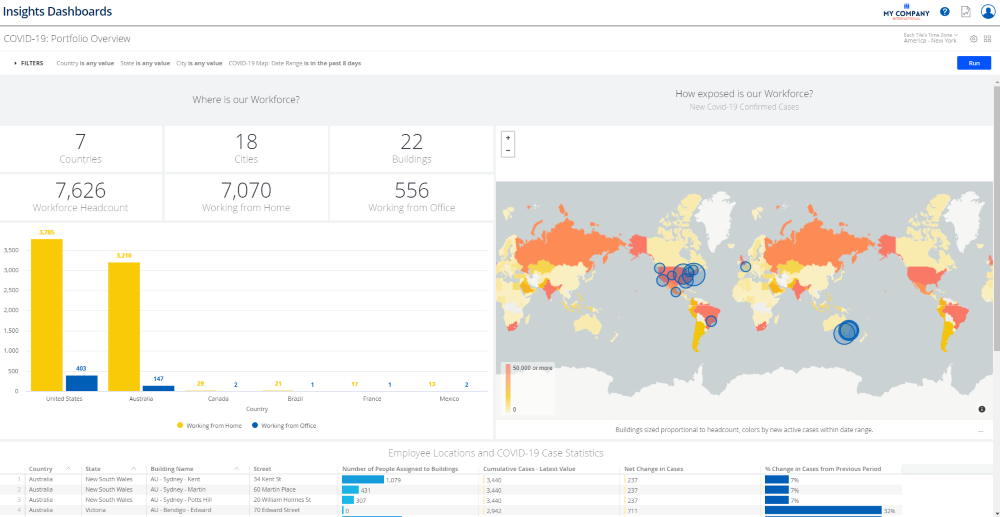
COVID-19: Portfolio Overview Dashboard
Gives you insights into where your people are and what the relative number of new COVID-19 cases reported has been over the last 7 days. This may be indicative of which locations you may be able to return to work sooner or later.
For details, refer to COVID-19: Portfolio Overview Dashboard.
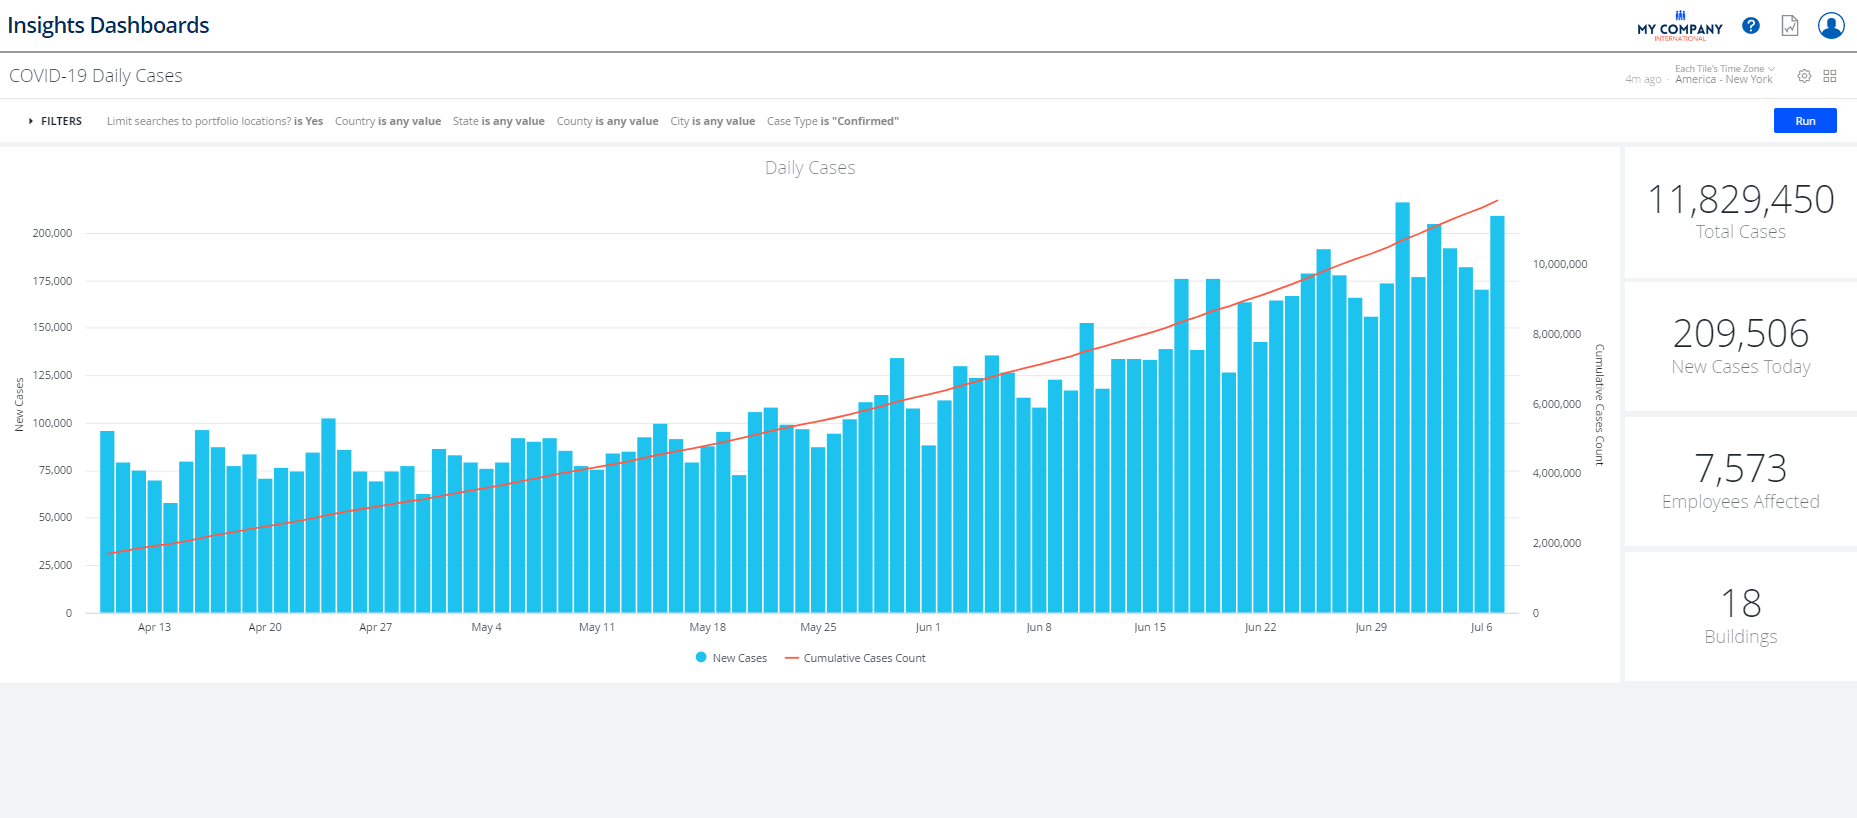
COVID-19: Daily Cases Dashboard
Gives you insights into the COVID-19 Daily Reported Cases "Curve" in the geographies where you have people (based on the filters applied).
For details, refer to COVID-19 Daily Cases Dashboard.
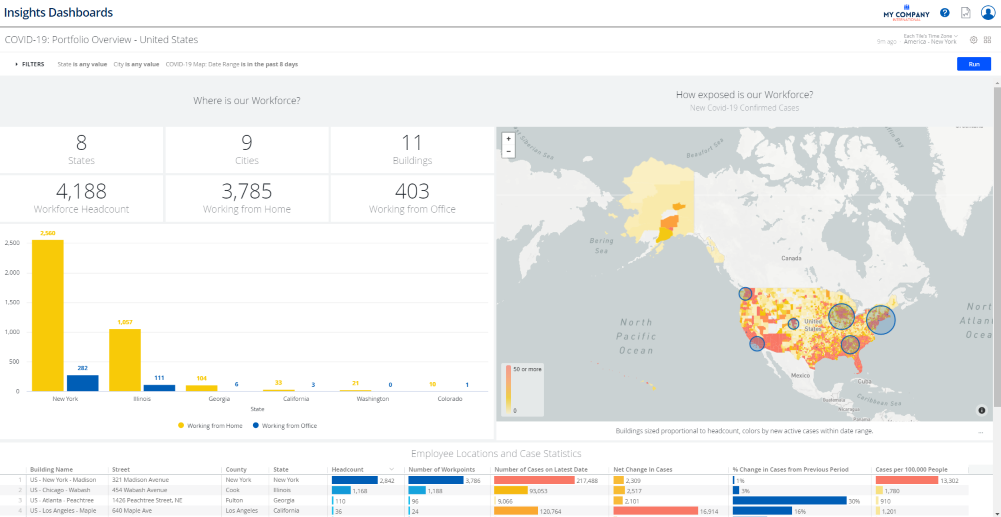
COVID-19: Portfolio Overview - United States Dashboard
Helps you visualize where your people are and what the relative number of new COVID-19 cases reported has been over the last 7 days. This shows some of the current effect the pandemic has on your organization and may suggest locations you may be able to return to work sooner or later.
This dashboard is similar to COVID-19 Daily Cases Dashboard except it is limited to the United States. You can interact with the US-specific COVID-19 data sets and map data which includes case statistics by county.
For details, refer to COVID-19 Portfolio Overview - United States Dashboard.
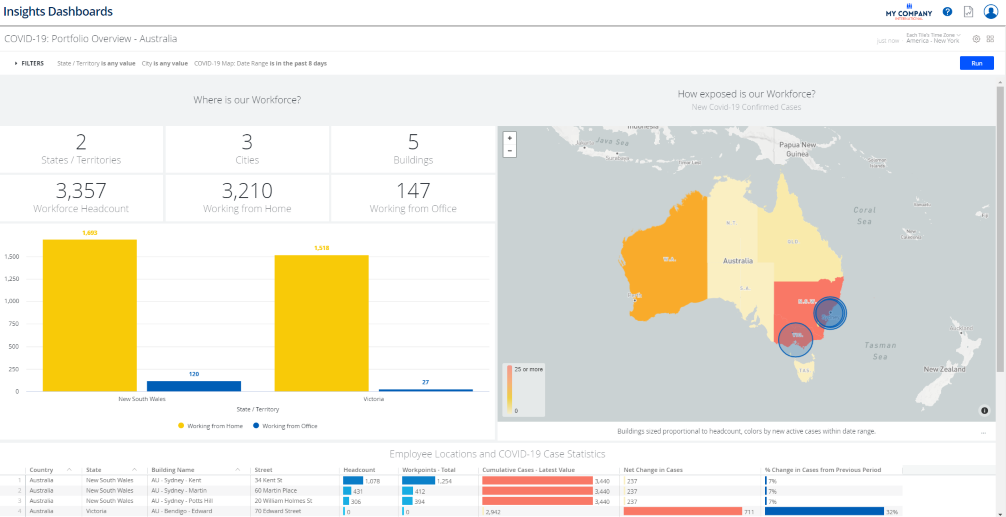
COVID-19: Portfolio Overview - Australia Dashboard
Helps you visualize where your people are and what the relative number of new COVID-19 cases reported has been over the last 7 days. This shows some of the current effect the pandemic has on your organization and may suggest locations you may be able to return to work sooner or later.
This dashboard is similar to COVID-19: Portfolio Overview Dashboard except it is limited to the United States. You can interact with the AU-specific COVID-19 data sets and map data which includes case statistics by state or territory.
For details, refer to COVID-19 Portfolio Overview - Australia Dashboard.
Regular Workplace Analysis
Arrange for regular analysis of your buildings to ensure that any prospective working space will be safe and suitable for returning employees using the Insights Dashboards.
Insight Dashboards
Below lists the dashboards for safe spacing and understanding your employee's locations.
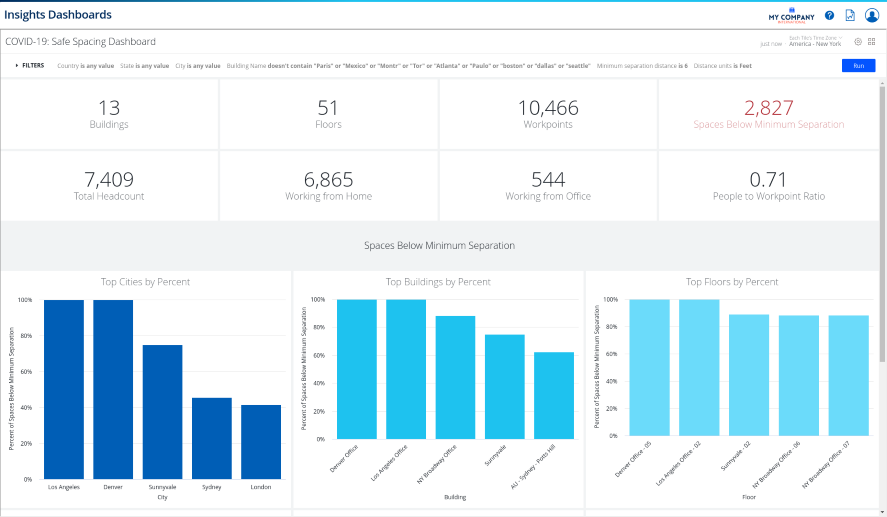
COVID-19: Workpoint Safe Spacing Dashboard
As return-to-work guidelines and strategies evolve and the maintenance of safe spacing in the workplace is a consistent concern. Whatever distance an organization decides to provide to its workers in any location, Space Planners need to know:
- how many workpoints meet the requirement.
- where any problem locations exist so they can further investigate or identify which spaces to take offline in order to maximize safe capacity.
For details, refer to Workpoint Safe Spacing Dashboard.
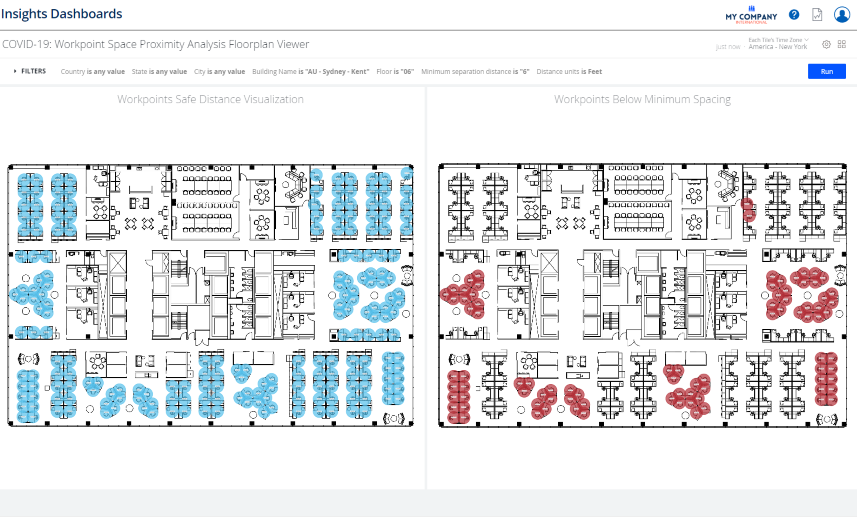
COVID-19: Workpoint Safe Spacing Floor plan Viewer Dashboard
Helps you visualize the amount of space you have around each workpoint. You can adjust the diameter of each red bubble through the filter panel.
For details, refer to Workpoint Safe Spacing Floor plan Viewer Dashboard.
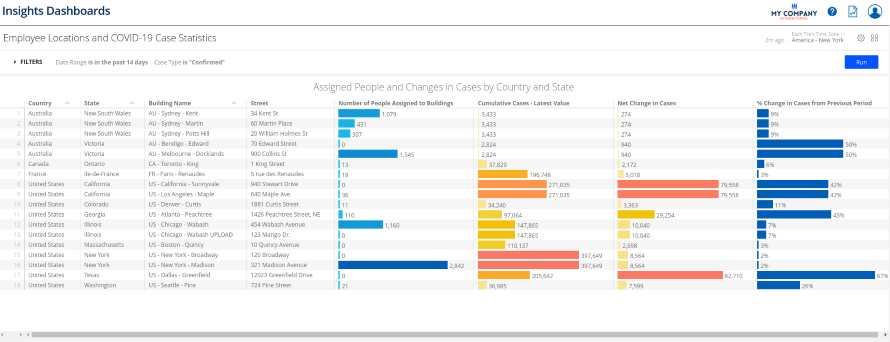
COVID-19: Employee Locations and COVID-19 Case Statistics Dashboard
Use this dashboard, as a stand-alone or in-conjunction with the Portfolio Overview Dashboard and this provides a deeper level of detail on the relative effect and trend of the pandemic to your organization.
For details, refer to COVID-19: Employee Locations and COVID-19 Case Statistics Dashboard.
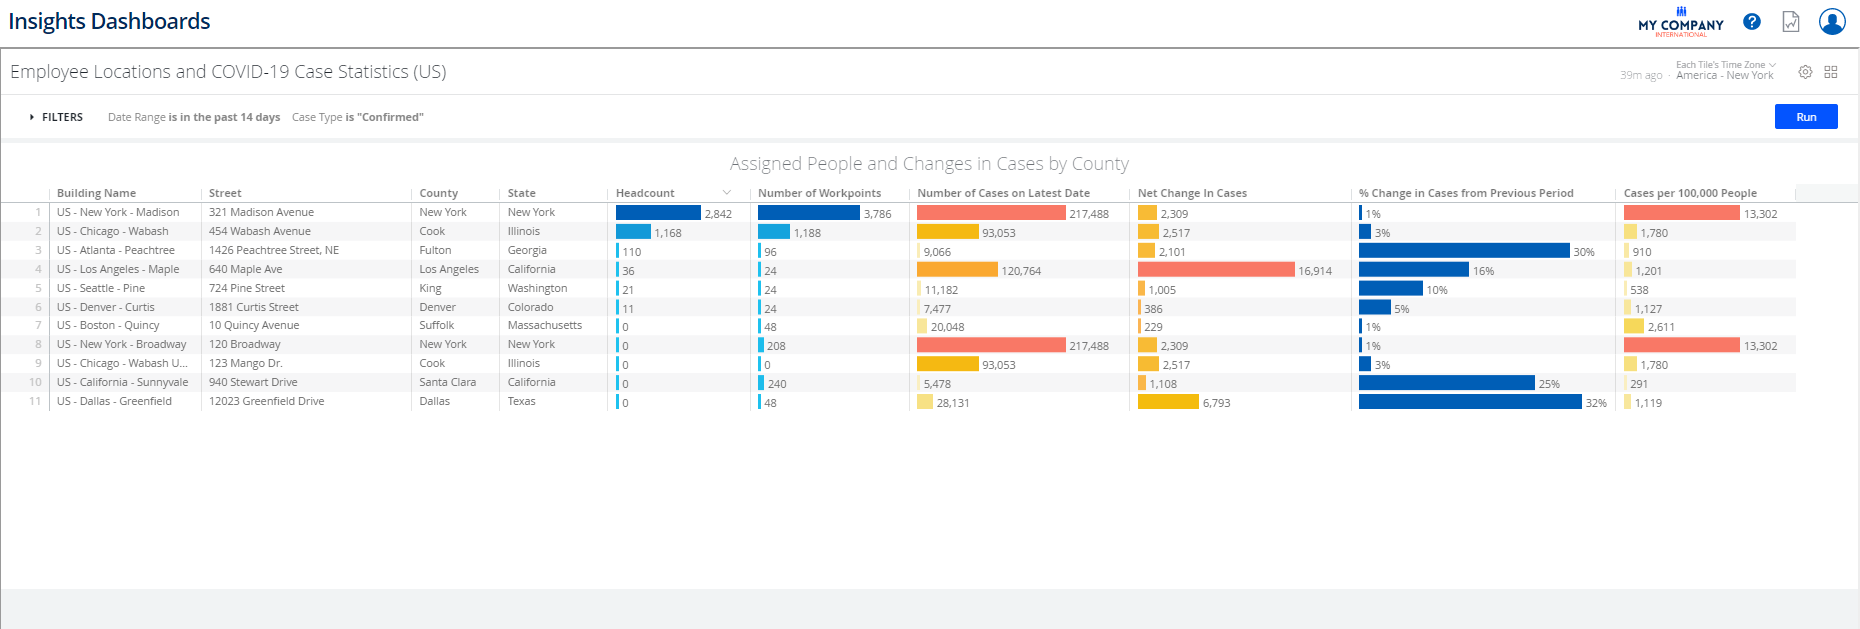
COVID-19: Employee Locations and COVID-19 Case Statistics (US) Dashboard
Use this dashboard, as a stand-alone or in-conjunction within the COVID-19 Portfolio Overview - United States Dashboard, as this provides deeper level of detail on the relative effect and trend of the pandemic to your organization’s people and locations within the United States. The table lists buildings together with case statistics specific to the county in which each building is located.
For details, refer to COVID-19: Employee Locations (USA) and COVID-19 Case Statistics Dashboard.
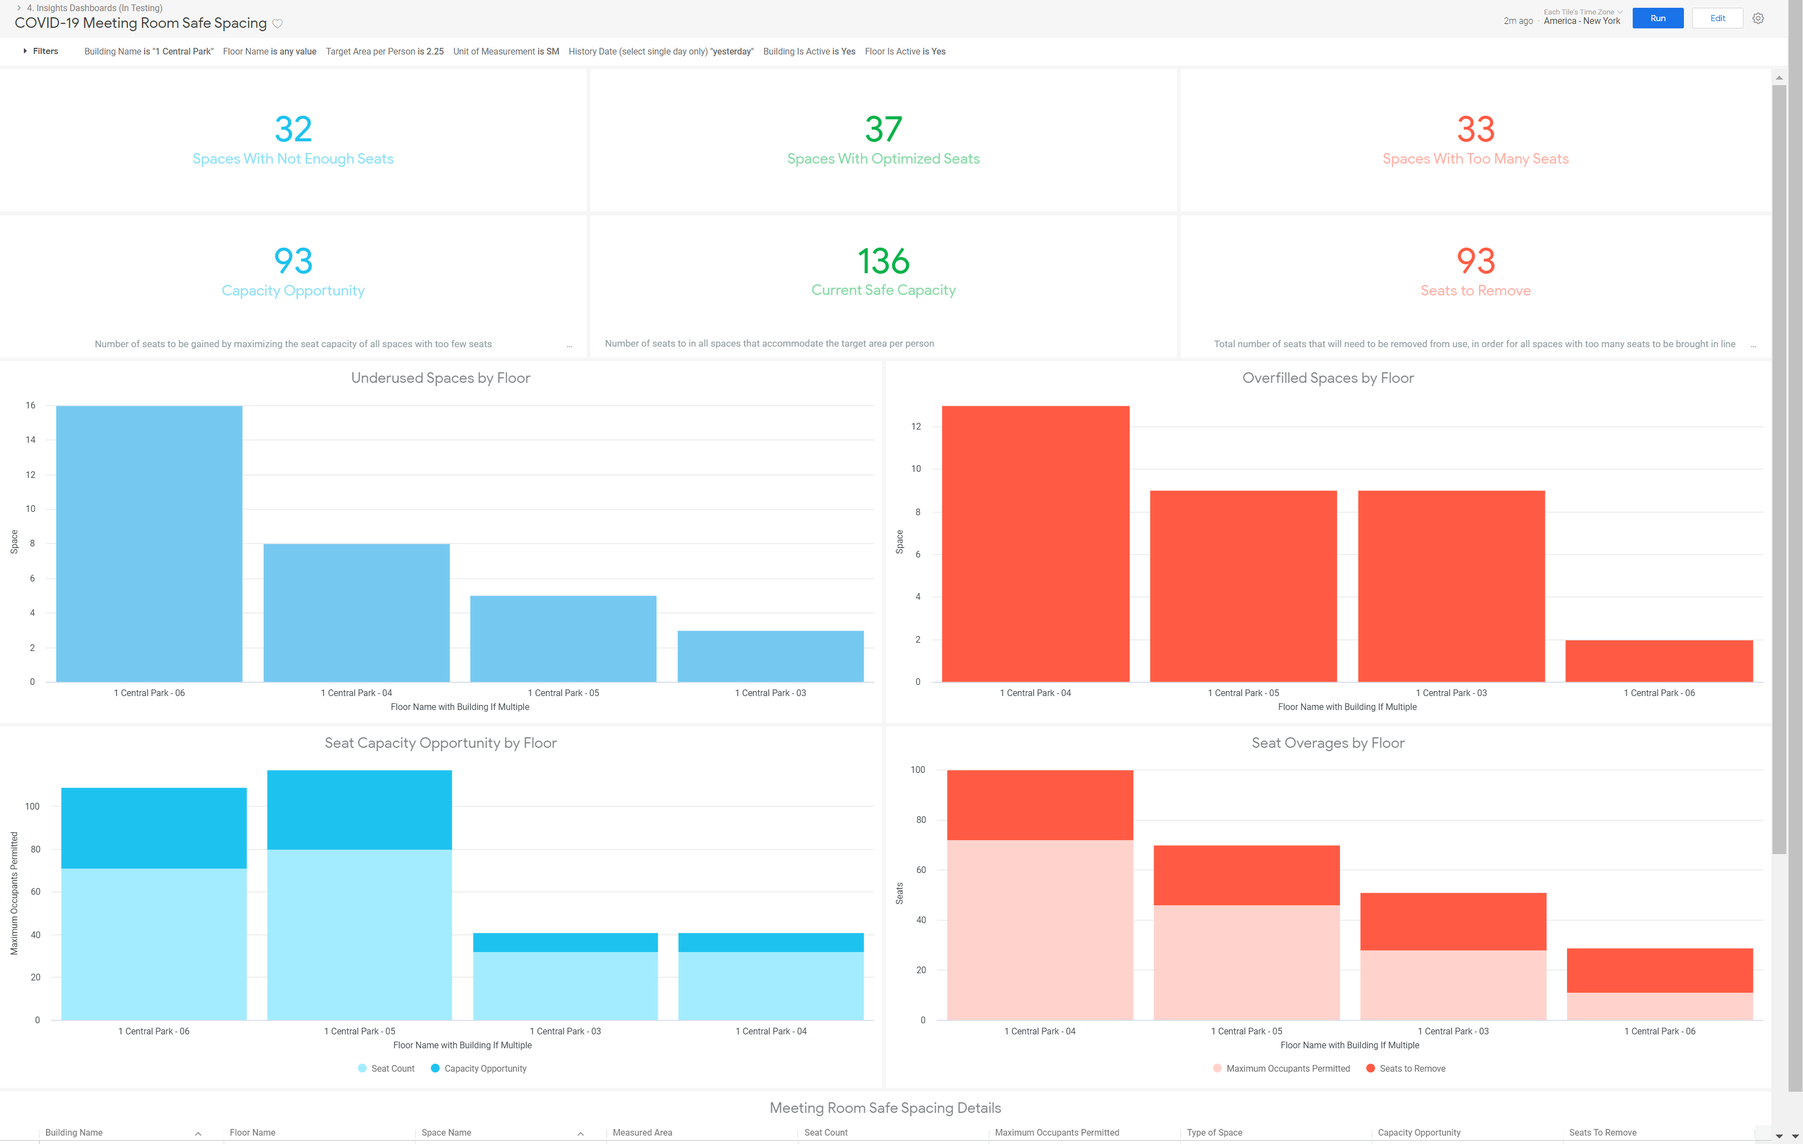
COVID-19 Meeting Room Safe Spacing Dashboard
For Space Managers who need to audit and adjust allowable meeting room capacities amid shifting requirements for social distancing in the workplace, this dashboard provides a list of conference rooms evaluated according to measured area per seat as set by the user. When viewed as a single floor, the dashboard displays a floor plan showing all meeting rooms highlighted to identify those with number of seats over, under, or within target capacity levels. Data tables similarly list spaces and can serve as action lists for making adjustments to the spaces' properties in Serraview.
For details, refer to Room Safe Spacing: Seats per Area Dashboard.
Monitor Social Distancing and Compliance
Ensure social distancing is being respected and attendance is not exceeding capacity that adheres to the new guidelines. The utilization data gathered from SVLive, Badge Swipe, Reservations, or Sensors will give you an understanding of your Workplace Utilization.
SVLive
Leverage a technology designed to capture real-time utilization of office space within a company for monitoring social distancing and compliance in real-time. It works by analyzing the computer network to determine which users are connected to the network, whether they have been active recently, and where they are located.
This data provides a platform for many property related functions including:
- Workplace optimization (based on actual utilization).
- People location functions such as Wayfinding, Kiosk, and Activity Based Working (ABW).
- Occupational Health and Safety (OH&S).
- Business Continuity Planning (BCP).
SVLive Utilization Reports
Below lists the SVLive Utilization Reports for monitoring social distancing and compliance.
111 Detailed Utilization Report
Displays detailed information about SVLive (Wired and Wi-Fi) utilization records for the date range and locations selected.
For details, refer to 111 Detailed Utilization Report.
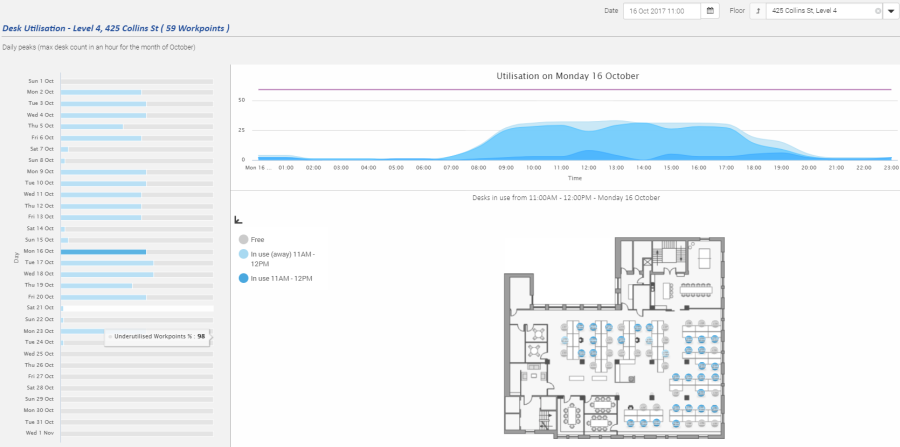
285 Utilization Point In Time Report
Displays a layered view of SVLive utilization for a specific floor at a point in time. As this report is specific to workpoint utilization, only wired Serraview Live data is included. The Wi-Fi data does not go down to the workpoint level therefore it is not included.
For details, refer to 285 Utilization Point in Time Report.
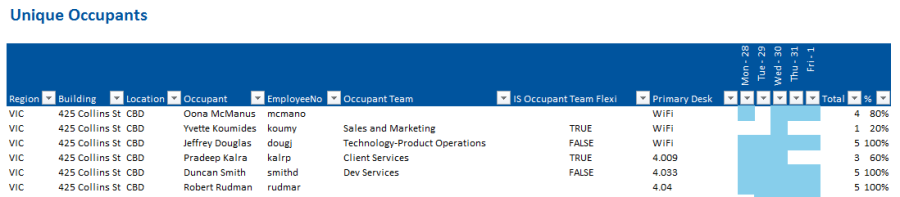
326 Unique People Count Utilization Report
Displays count of unique people (minimum, maximum, average) for a given floor and period.
For details, refer to 296 Unique People count Utilization Report.
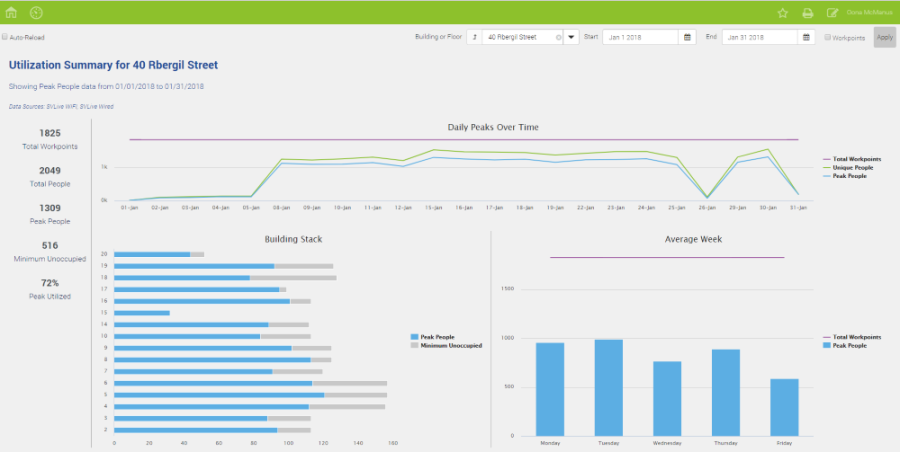
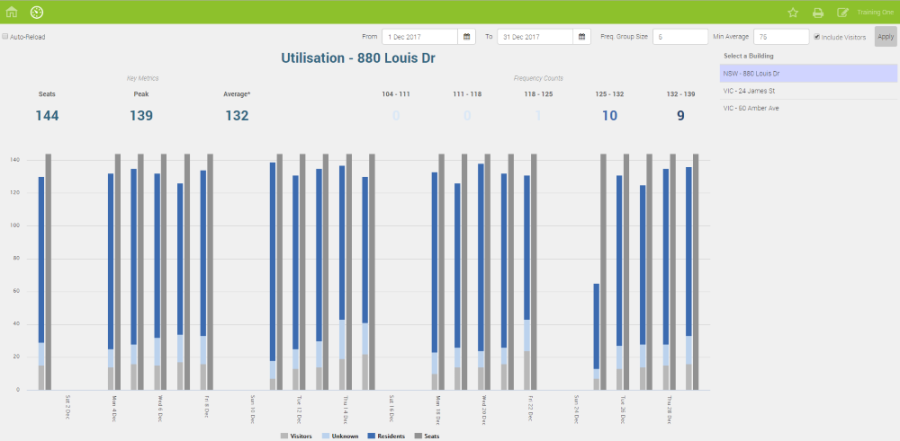
326 Utilization - Building and Floor Summary
Displays an overview of key utilization statistics for a building or floor over a chosen date range.
For details, refer to 326 Utilization - Building and Floor Summary.
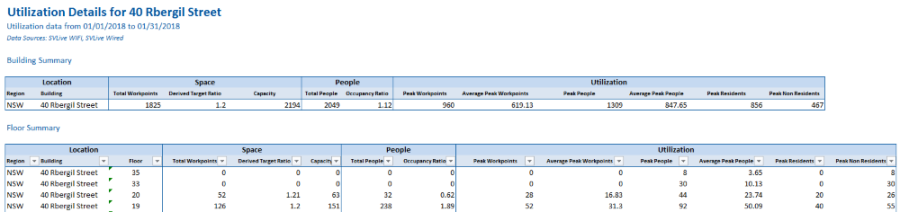
327 Utilization - Building and Floor Details
Details the utilization for all buildings and floors within the chosen location (you can choose a floor, building, or region, or leave the filter blank to choose the entire portfolio).
For details, refer to 327 Utilization - Building and Floor Details.
Badge Swipe
Leverage any device that generates an electronic access record, including turnstiles, speedgates, and card readers for monitoring social distancing and compliance.
Badge Swipe Utilization Reports
Below lists the Badge Swipe Utilization Reports for monitoring social distancing and compliance.
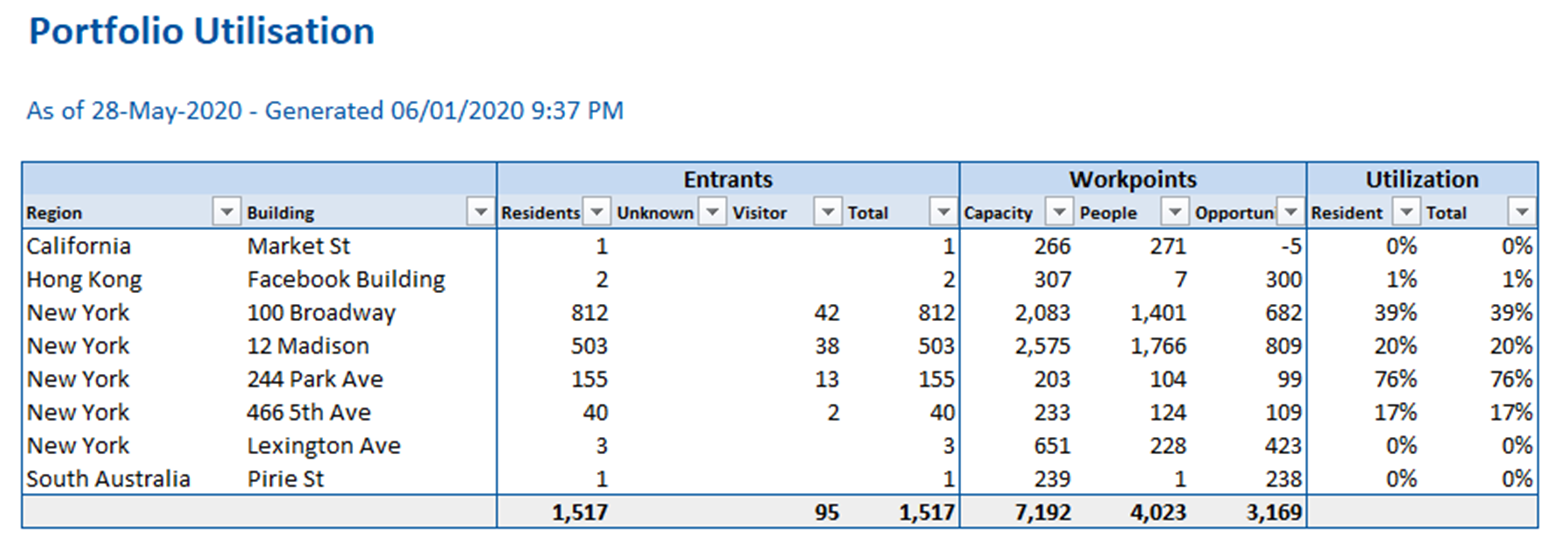
221 Badge Swipe Portfolio Utilization Report
This report provides a quick summary of a chosen day of Badge Swipe data. As a simple table, you can easily identify buildings that may have issues around capacity or non-residents utilizing the space.
For details, refer to 221 Badge Swipe Portfolio Utilization Report.
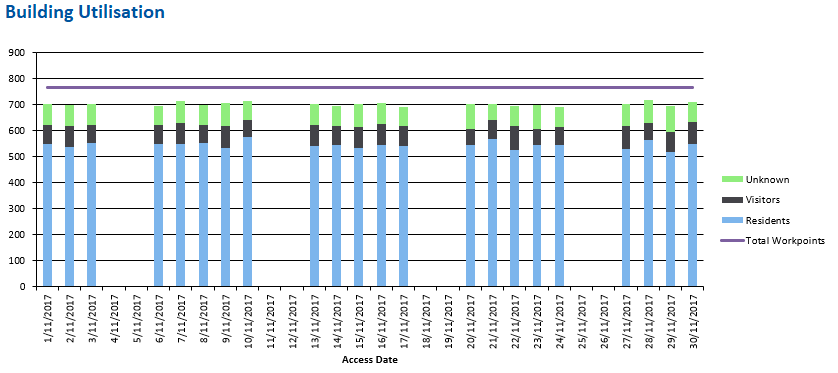
223 Badge Swipe Building Utilization Report
Displays every person who was seen in the Badge Swipe data entering the chosen building(s) during the selected data range. It displays how many total days the person was there during the date range, and includes a grid that indicates which days each person was present and absent.
For details, refer to 223 Badge Swipe Building Utilization Report.
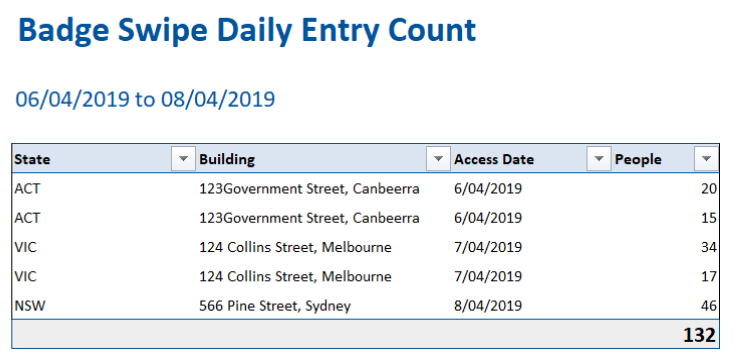
226 Badge Swipe Daily Entry Count Report
Displays the number of people seen in every building with Badge Swipe for each date in the selected date range.
For details, refer to 226 Badge Swipe Daily Entry Count Report.
292 Badge Swipe Utilization Dashboard
The dashboard displays the Badge Swipe utilization statistics of a building for a selected date range.
For details, refer to 292 Badge Swipe Utilization Dashboard.
Contact Tracing
Assist with the contact tracing and identify areas to be cleaned.
Proximity Reports
Below lists the proximity reports that can be used for contact tracing.
Proximity (SVLive) Report
Identify those who have been detected in the same space, floor, or building, and is available for clients who have SVLive data in Serraview.
- Investigate SVLive location of individual person(s) and proximity to others.
- Available to all clients who have SVLive data.
- Includes Wired and Wi-Fi data.
- Includes Room Booking data where available.
- Parameters for location, data range, and individual person(s).
- This report is found in the Reporting module.
Find out more in Proximity (SVLive) Report.
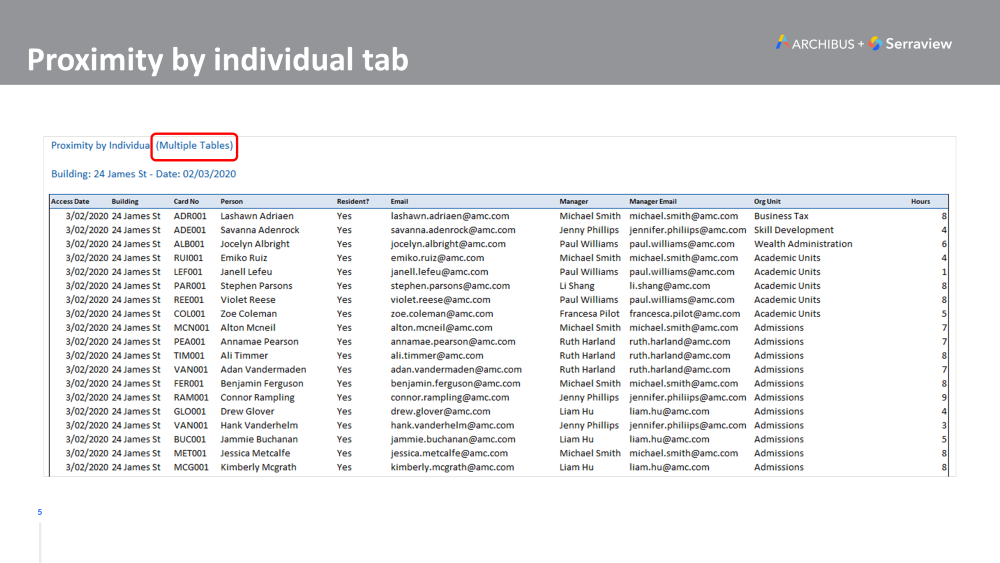
Proximity by Individual Example
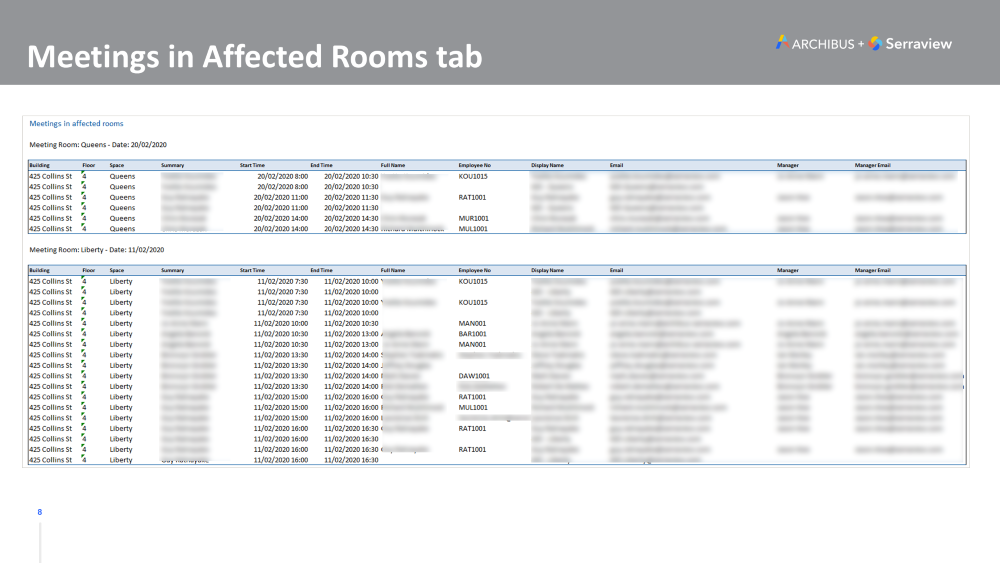
Meetings in Affected Rooms Example
Proximity (Badge Swipe) Report
Investigate the movement of an individual and identify those who have been detected in the same building and is available for clients who have Badge Swipe data in Serraview.
- Investigate badge swipe of individual person(s) and proximity to others.
- Available to all clients who have Badge data.
- Parameters for location, date range, and individual person(s).
- This report is found in the Reporting module.
Find out more in Proximity (Badge Swipe) Report.
Proximity by Individual Example