Sensor Health Dashboard
Purpose
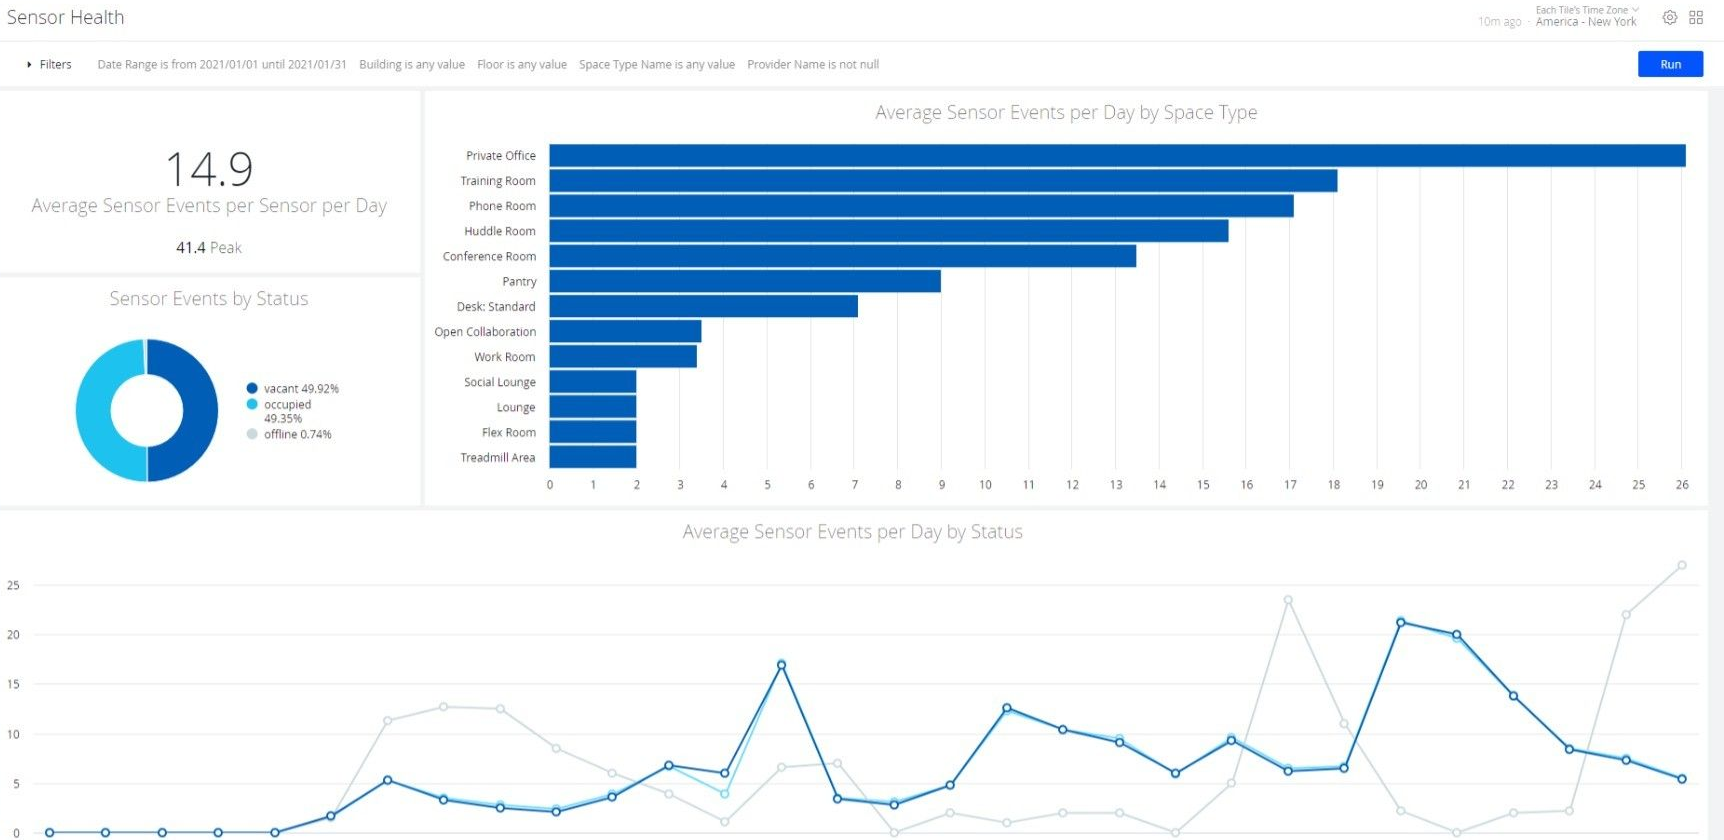
This dashboard identifies how many sensor events per day the sensors record. It groups events by:
- Status, to show which statuses are produced the most (including offline statuses).
- Space Type, to highlight how one space type might be performing compared to others.
This can identify “unhealthy“ sensors which are recording fewer events than average, or those which produce fewer events (along with a date range) and need to be repaired.
Special Data Elements
- Average Sensor Events per Day - the total number of sensor events divided by the total number of days that have a sensor event record for each sensor.
Special Filters
- None
Limitations
- None