Block and Stack (VBS) Quick Reports
The quick reports and dashboards are configurable by your System Administrator. They can choose different reports to run and the parameters set on each report for maximum benefit for your business. For information on setting up the quick reports, refer to Quick Reports.
Run the Quick Reports
You can adjust the following Block and Stack components to generate reports that reflect your current view. For example, you can either:
- select neighborhoods or teams
- group by a level in org unit hierarchy
- change the workpoint color to either occupancy or person allocation
- show labels with or without occupants, space types, and/or name
From the module complete the following:
- Use the Location Selector to select the building and floor.
- Adjust your Block and Stack.
If you have a team(s) selected, the Floorplan Block report will run only for your selection. Use the Ctrl and Shift keys to select multiple teams before running your report.
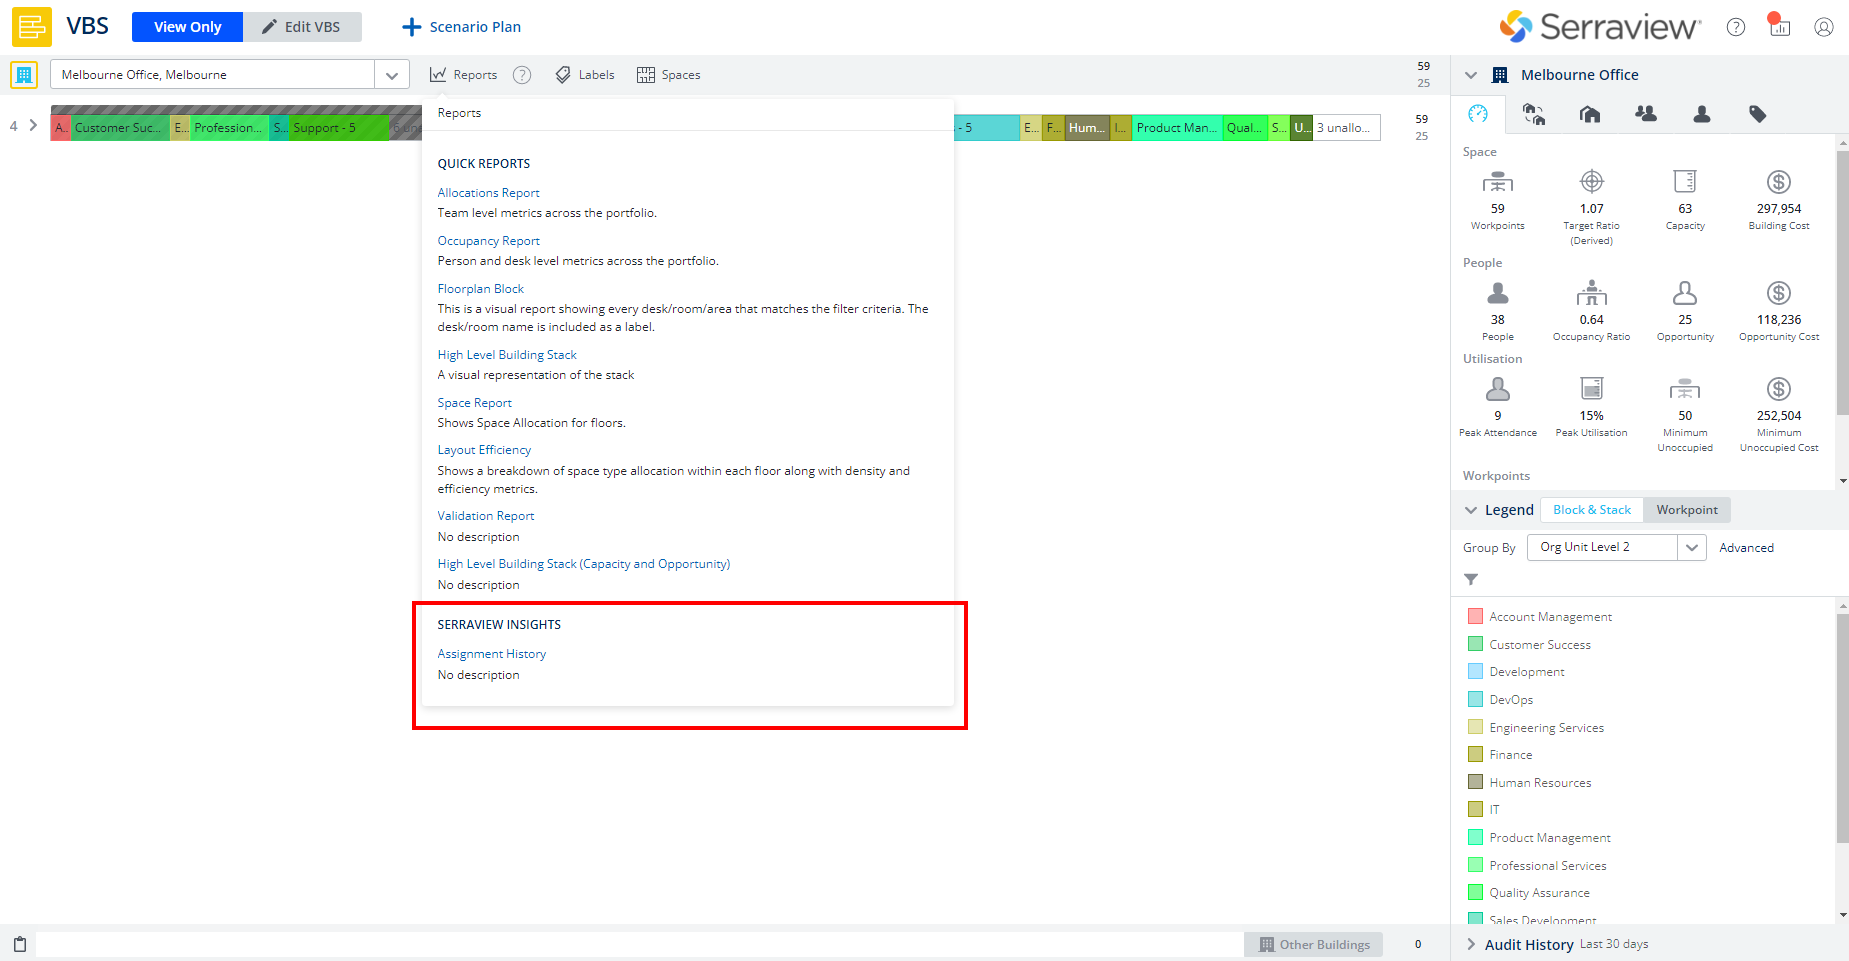
3. Click the Reports icon.
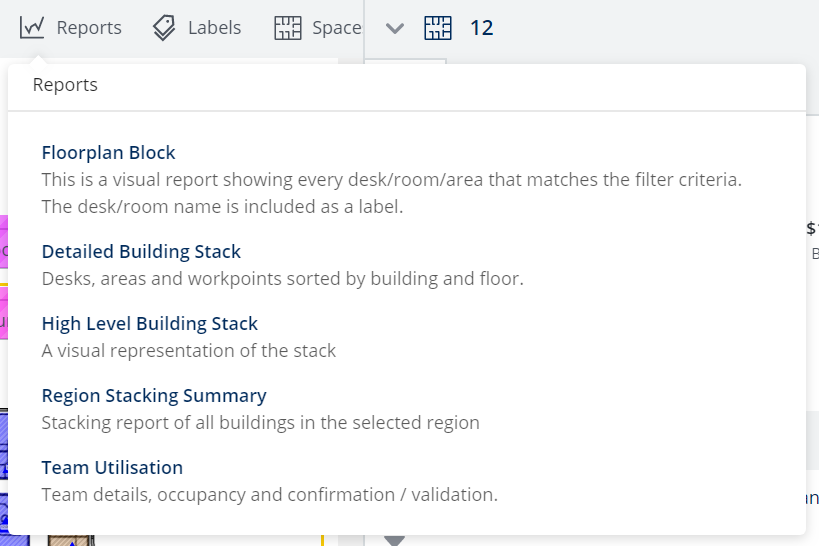
4. Click the quick report.
5. Your report will run and download to your device. When it is downloaded, you can open the report and view its content.
The reports available for this module are:
|
# |
Report Name |
Description |
|---|---|---|
| 3 | Allocations Report provides team level metrics across the portfolio. | |
| 4 | Occupancy Report displays person and desk level metrics across the portfolio. | |
|
22 |
Floorplan Block Report is the most commonly used floorplan reports. It provides a visually effective view of floor blocking, and can be colored at any level of the Organizational Unit Hierarchy. |
|
|
36 |
This report displays a detailed breakdown of the stack for each floor shown in the VBS. |
|
|
46 |
This report provides a visualization of a building stack and can be colored at any level of the Organizational Unit Hierarchy. |
|
| 67 | The Space Report shows one or more Space Types in different colors on the floorplan. | |
| 75 | Displays a breakdown of space type allocation within each floor along with density and efficiency metrics. | |
|
78 |
This report consolidates each region onto one sheet where possible to provide for easy presentation of the stack at a regional level. |
|
|
162 |
This report displays the changes made to VBS between the chosen date period. |
|
|
246 |
246 High Level Building Stack (Capacity and Opportunity) Reports |
This report provides a visualization of a building stack and can be colored at any level of the Organizational Unit Hierarchy. |
|
278 |
278 Region Stacking Report (Capacity and Opportunity) Report |
This report consolidates each region onto one sheet where possible to provide for easy presentation of the stack at a regional level. |
Run Serraview Insights Dashboard
From the module complete the following:
- Use the Location Selector to select the building and floor.
- Click the Reports icon.
- Click the dashboard.
The dashboard will display and it will be filtered for the building.