SVLive Building and Floor Utilization Dashboard
Purpose
This dashboard provides the advanced information regarding SVLive. Not only are trends included, but attendee behaviors and weekly breakdowns are covered as well. This helps inform space planners and leadership what % of the workforce are coming in for what % of the days, which will help assist in getting the right allocations. A range of filters are included, such as threshold which will allow detection of any over building or floor capacity issues that have occurred.
For similar information in a simpler form, see SVLive Essentials Dashboard .
Special Data Elements
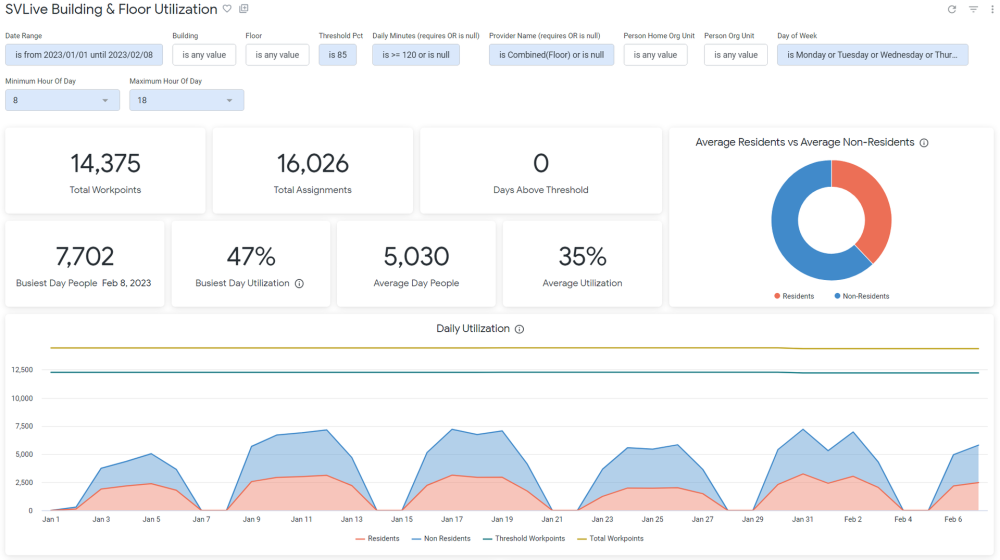
- Total Workpoints: This is the number of workpoints in the building, and matches what is shown in Buildings & Floors (not tied to the number of workpoints utilized)
- Busiest Day People: The highest count of people that appeared on SVLive that appeared on any single day
- Busiest Day Utilization: The Busiest Day People divided by the total workpoints, displayed as %
- Average Utilization: The average SVLive person count divided by the total workpoints, for the date range
- Days Above Threshold: The count of days that had SVLive person counts above the threshold % multiplied by the total workpoints.
- Daily Utilization - Residents: The count of people who appeared on SVLive and have a home location on the floor they were detected on
- Daily Utilization - Non-Residents: The count of people who appeared on SVLive and do not have a have a home location on the floor they were detected on
- Average Week - People: The average count of people who appeared on SVLive for each given day
- Trend - Average People: The average number of people that appeared on SVLive on each day within that month
- Trend - Average Utilization: The average number of people that appeared on SVLive on each day within that month divided by total workpoints
- Trend - Busiest Day People: The highest count of people that appeared on SVLive that appeared on any single day within that month
- Trend - Busiest Day Utilization: The Busiest Day People of that month divided by the total workpoints, displayed as %
- Attendee Days/Week - The number of days attendees are detected in a given week. Attendees are categorized by the number of days they appeared that week and that % is the % of attendees for that week that appeared for that many days. If the filter contains a partial week, it will skew that weeks data.
- Attendee Days/Month - The number of days attendees are detected in a given month. Attendees are categorized by the number of days they appeared that week and that % is the % of attendees for that week that appeared for that many days. If the filter contains a partial month, it will skew that months data.
Special Filters
- Threshold filter - Controls the threshold bars and applies to the Days Above Threshold. Threshold bar is Threshold % multiplied by total workpoints.
- Daily Minutes filter -The number of minutes the person had to be detected within a day to appear on this dashboard
- Minimum/Maximum Hour of Day filter - The hour range (per day) that is checked for SVLive data. People who only appeared on SVLive outside of this hour range will not appear in this dashboard.
- Provider Name (requires OR is null) - This filter affects how minutes are calculated (for the Daily Minutes filter), and what sources are included. The ‘Combined’ providers includes both SVLive Wi-Fi and Wired, and aggregate the minutes to the bracketed level (for example, ‘Combined(Building)’ removes all overlap of minutes at the building level. Regardless of selection, you must include ‘OR is null’ to have correct occupancy metrics (Total Workpoints, Total People)
Limitations
- As someone can appear in multiple locations within 1 day, of which they could be a resident or non-resident, it is possible for the total (Busiest Day People) to be less than the sum of Residents and Non-Residents.
-
The following tiles cannot be downloaded as a CSV file:
-
Busiest Day Utilization
-
Daily Utilization
-
Trend (Last 12 Months)
-