Combined Utilization Essentials Dashboard
Purpose
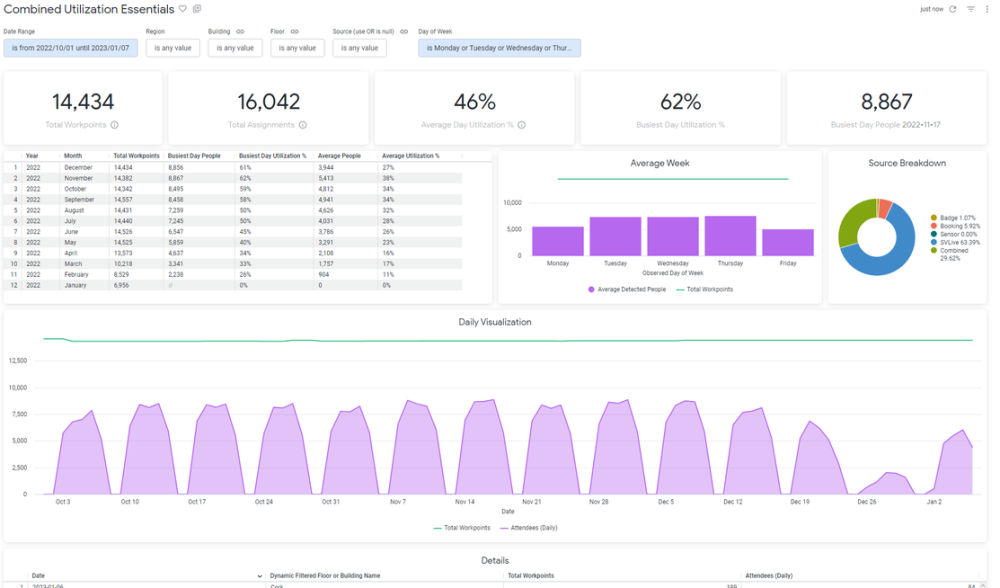
This dashboard provides the most essential information regarding utilization. How utilization data has been trending, what data sources are contributing, and how many attendees each day where detected. This provides the core utilization information for making strategic decisions and creating informed occupancy plans.
For a more flexible and detailed dashboard built off the same data, see Combined Utilization Summary Dashboard.
Special Data Elements
- Attendees = The number of unique people detected, limited to staff. This is unique people across each source. For example, if John Smith had both a desk booking AND a badge record, he would only count once to the daily attendees.
- Busiest Day Utilization % = Busiest Day People divided by that days Total Workpoints.
Special Filters
Source (use OR is null) filter - This filter lets you limit what sources contribute to the metrics you see. You MUST include ‘or is null’ to get accurate Total Workpoints and % values.
Limitations
- Average Day Utilization % uses Total Workpoints based off the latest date in the range Total Workpoints.
-
The following tiles cannot be downloaded as a CSV file:
-
Busiest Day Utilization %
-
Trend tile (unamed)
-
Daily Visualization
-