Density-Based Capacity Report
Watch the Density-Based Capacity Report Video
Transcript

Serraview is committed to assisting Corporate Real Estate teams in the event an incident disrupts everyday working life for your employees and your business.
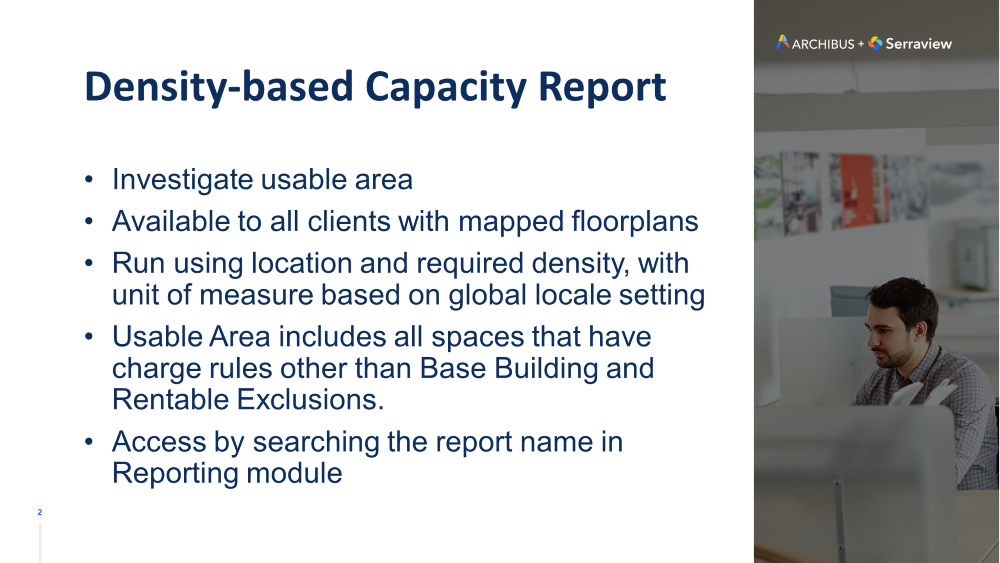
The Density-Based Capacity report has been created to assist when looking to assess usable area within a building for example to enable the implementation of social distancing measures within the workplace.
This report can be used by all clients who have floorplans loaded and mapped in Serraview.
This report allows you to enter your region, building or floor, and set a parameter for density, using your global locale settings to generate data based on square meters or square feet.
It shows usable area which include all spaces that have a charge rule other than Base Building and Rentable Exclusions.
This report has been added to your custom reports in your Serraview environment. You can find it by searching for the report name in the Reporting Module and it is available in the Serraview 2.0 and Serraview 3.0 platforms.
It will allow you to identify opportunities at a floor or space level, based on the desired density, and takes into account all spaces that have a charge rule other than Base Building and Rentable Exclusions.
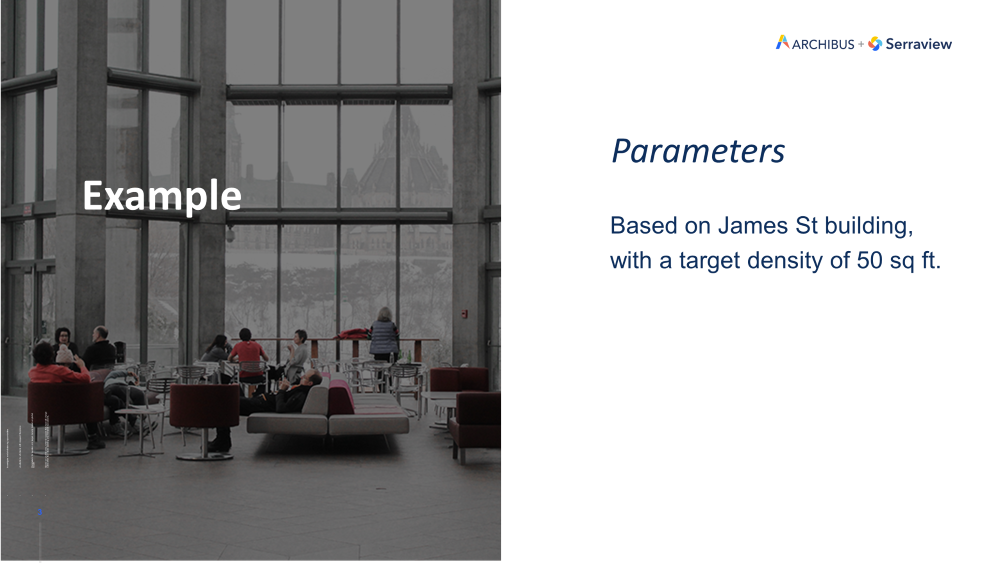
For this example, I have selected the James St building, and 50 square feet as the density.
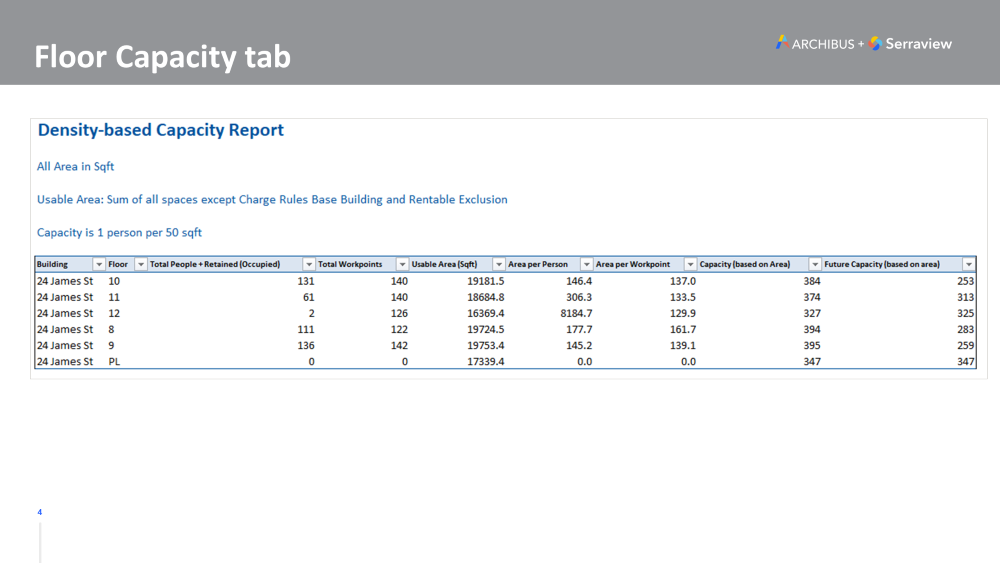
On the Floor Capacity tab, you will see:
- (Building column) (Floor column) building and floor.
- (Total People + Related (Occupied) column) total people column, which shows the total number of people assigned to the floor and including any fixed workpoints with retention status that counts toward occupancy.
- (Total Workpoints column) total number of workpoints on the floor.
- (Usable Area Sqft column) the usable area.
- (Area per Person column) the area per person, based on the total people column.
- (Area per Workpoint column) the area per workpoint, based on the current mapped workpoints
- (Capacity (based on Area) column) the capacity, which shows the number of people able to be seated within the usable area based on the set density parameter
- (Future Capacity (based on area) column) and the future capacity, which takes the capacity figure and subtracts the total people figure.
With this information you can see if you need to take action to move people from a space to meet your new density requirements.
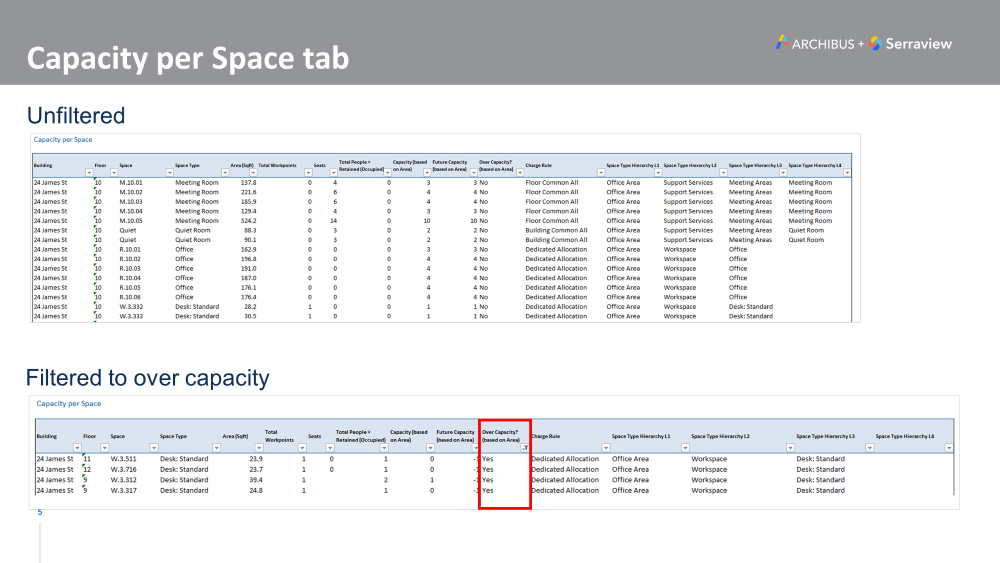
The Capacity per Space tab shows all usable spaces you have on the floor, individually listed including the Capacity and Future Capacity, and a column to show any spaces that are currently over capacity.
For example, if I filter to show current usable spaces that show they are over capacity, I can see I have 4 workpoints that have an area smaller than 50 square feet but have assigned people, indicating I may need to move the assigned people from those spaces.
We hope you will find this report useful and enable you to quickly identify opportunities relating to density and usable area.