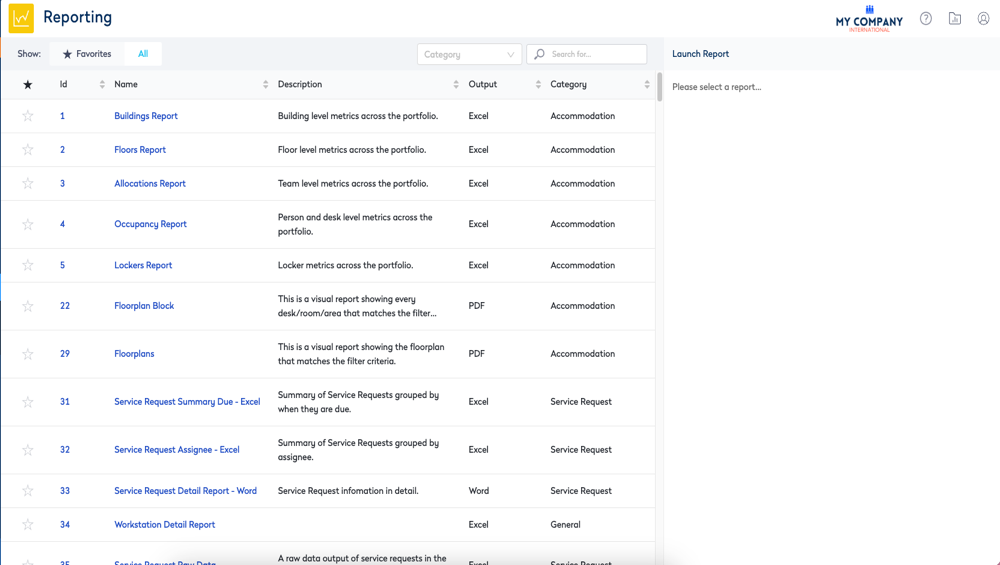
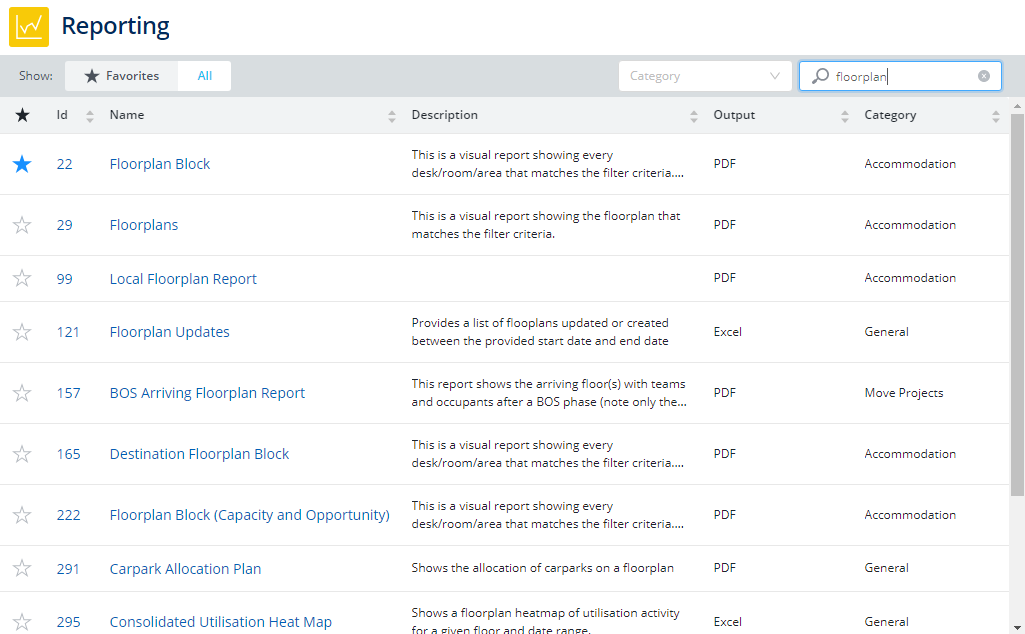
Navigate Reports
- Filters
- Category drop-down
- Search field
- Standard reports list
- Launch Report panel
From the Report module screen you can:
- Favorite a Report
- Show Filters
- Clear the Reports Queue
- Display Reports by Category
- Search
- Generate a Report with Parameters applied
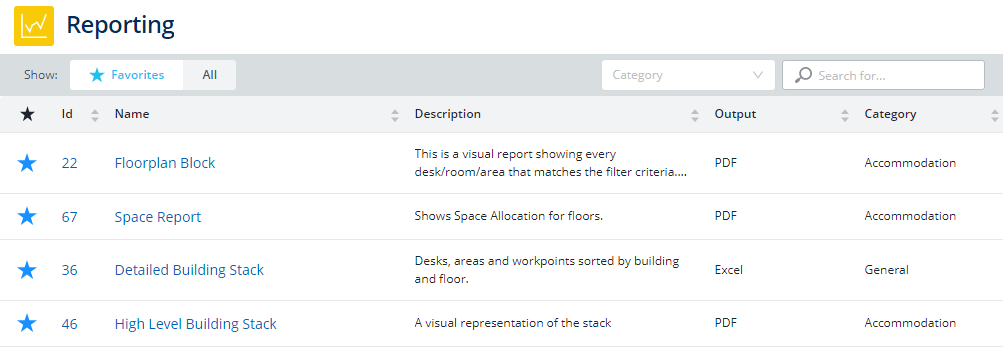
Favorite a Report
If you have a report that you frequently run then this can be added as a favorite report.
- In the Search field, enter the report ID number or the name of the report.
- For the report to favor, click the Favorites
 icon.
icon.

To unfavor a report, click the Favorites ![]() icon.
icon.
Show Filters
The default show filter is All and this displays all the reports.
![]()
Use the filter to show the favorites reports
- From the Show Filters, click the Favorites. This will change the filter to display only the favorite reports.
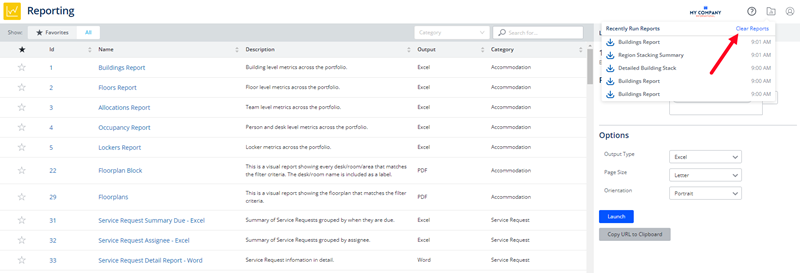
Clear the Reports Queue
During the day you will have run many reports and if you need to you can clear the reports queue.
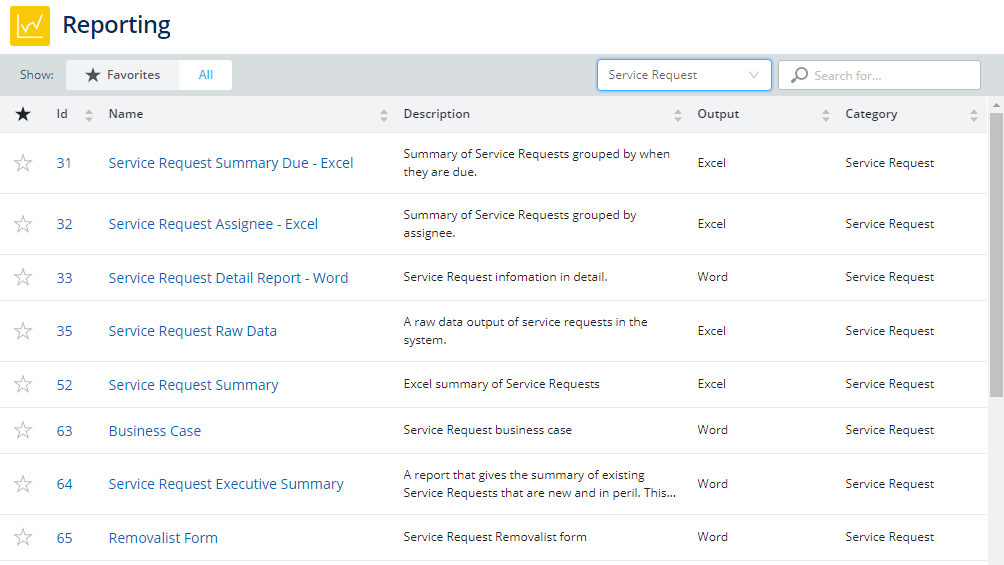
Display Reports by Category
From the Category drop-down, select either:
- Accommodation
- Business Continuity
- General
- Move Projects
- Service Request
For example, when the Service Request is selected the report list displays only the Service Request reports.
To clear the category selection, click the X icon.
Search
- In the Search field, enter the report ID number or the name of the report. The search results display.
To clear the search, click the X icon.
Generate a Report with Parameters applied
Each report will contain different parameters that can be set before you launch a report.
In this example, the 22 Floor plan Block report contains the following parameters.
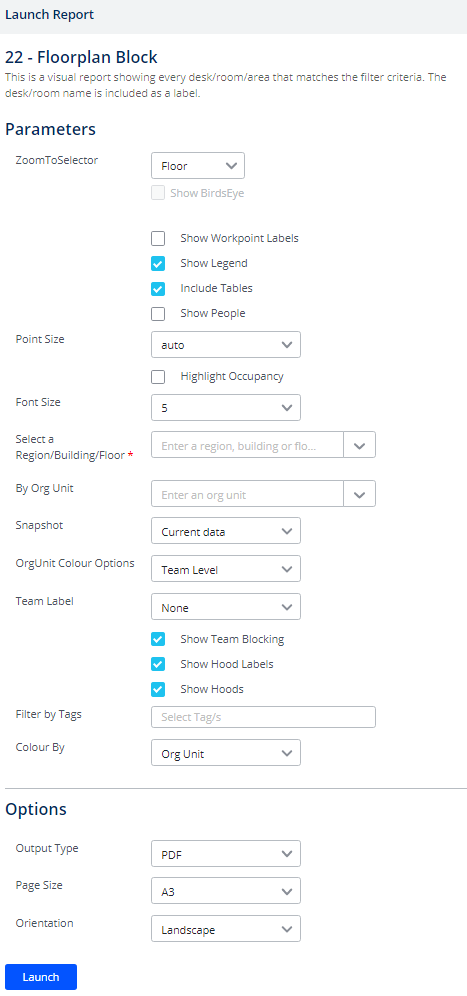
The table below describes the parameters.
| Field | Description |
|---|---|
| ZoomToSelector drop-down |
Select either:
|
| BridsEye check box | If you select either Zone or Team, the Show BridsEye check box will become enabled. |
| Point Size drop-down | Select auto or the point size number. |
| Highlight Occupancy check box | Check the Highlight Occupancy check box. |
| Font Size |
From the Font Size drop-down, select the number. |
| Select a Region/Building/Floor drop-down |
Either enter the name of the building/floor or click the drop-down to navigate to the building/floor. |
| By Org Unit drop-down | Either enter the org unit name or click the drop-down to navigate to the org unit. |
| Snapshot drop-down | Either select Current data or the name of the snapshot. For more information, refer to Snapshots. |
| OrgUnit Color Options drop-down |
Either select:
|
| Team Label drop-down |
Either select:
|
| Show Team Blocking check box | Check the Show Team Blocking check box. |
| Show Neighborhood Labels check box | Check the Show Neighborhood Labels check box. |
| Show Neighborhood check box | Check Show Neighborhood check box. |
| Filter by Tags field |
Select the tag from the list and you can select multiple tags. Click the X icon to clear the tag. |
| Colour By drop-down |
Either select:
|
The table below describes the options.
| Field | Description |
|---|---|
| Output Type |
From the Page Size drop-down, select: Some reports will let you select from CSV, Excel, or PDF. |
| Page Size |
From the Page Size drop-down, select:
|
| Orientation |
From the Orientation drop-down, select:
|