Building Stack Dashboard
Purpose
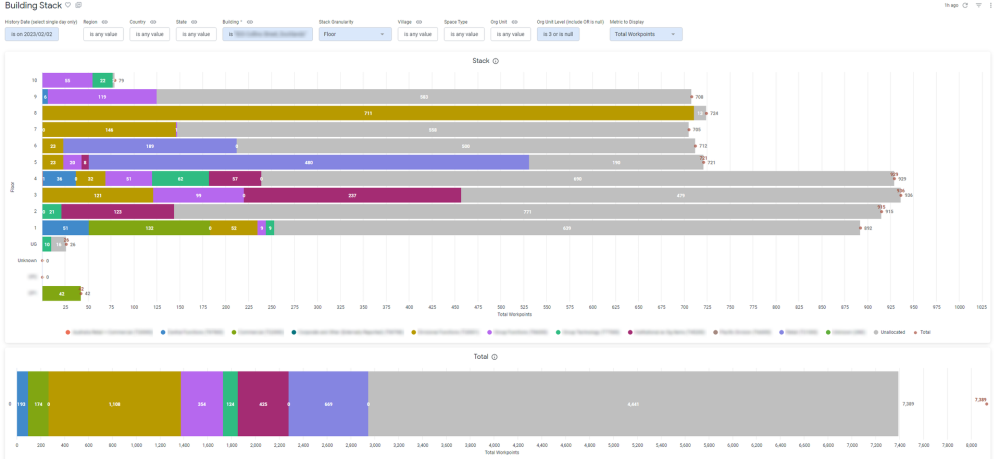
This dashboard produces occupancy data as a stack, similar to Serraview's Block and Stack (VBS) module.
The controls in this dashboard will help you slice the data whichever way you need, so Space Planners can make effective plans. There are controls to let you examine multiple buildings at once, as well as adjust the granularity, from Building to Neighborhood. Specific details for each org unit and floor are included as tabular tiles at the bottom. You can also control the metrics being displayed, including the standard Total Workpoints, the people based Total Assignments and the flexible or hybrid supporting Assignment Capacity.
Note that this dashboard uses the Baseline Metrics for its statistics and this allows it to have the flexibility in filters. However, there may be differences between this dashboard and the Serraview Block and Stack (VBS) module. Learn more about Baseline Metrics.
Special Data Elements
- Total Assignments = Count of person assignments (equivalent to Serraview Total People) plus Retained (Occupied) workpoints.
Special Filters
- Stack Granularity filter - Determines the grouping and text for the Stack Y Axis
- Metric to Display filter - Determines the metric displayed in the Stack and Total tiles. Tabular tiles include all fields.
- Org Unit Level (include OR is null) filter- Determines the grouping of teams/org units. Applies to all tiles. You can adjust the level as needed, but 'OR is null' must be included for the dashboard to work correctly.
Limitations
- In some instances you may notice that on hovering metrics you see decimal values. This is due to the way metrics in neighborhoods are portioned. Learn more about Baseline Metrics.