Generate and download a report
You can access the Reports module via:
- Navigate to Analytics > Reporting.
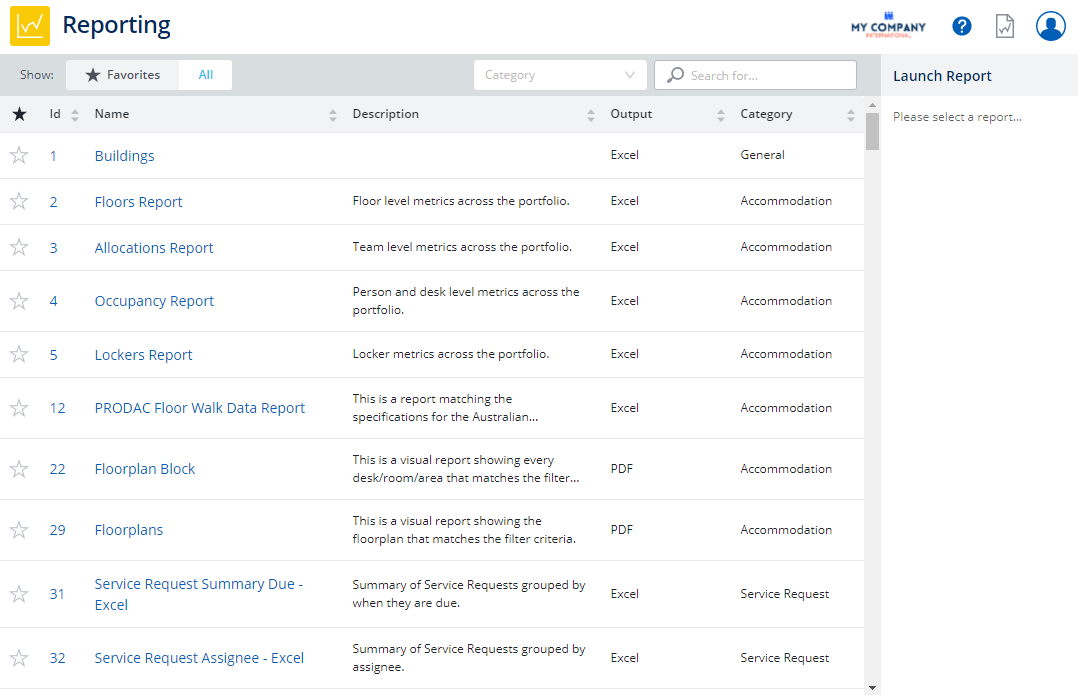
The reports display in a list and each report has an ID number and a title. The reports are generated to different formats, either Excel, PDF, or Word and the data may be arranged in different styles either chart, table, or floorplan.
You can locate and run a report.
- In the Search field enter the report ID number or the name of the report.
- Click on a report on the left to see the parameters display in the right-hand panel.
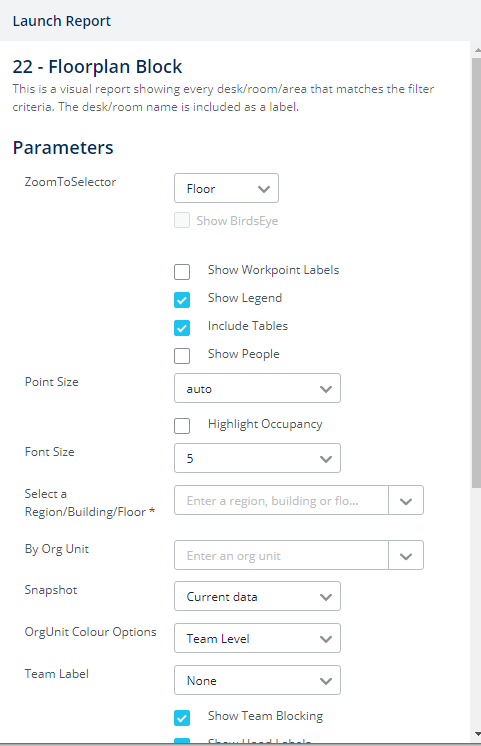
3. Adjust the parameters as required.
4. Click the Launch button. The report will be run in the reports queue and the Reports Queue icon will change in the global header.

5. Click the Reports Queue icon. The report will be run in the reports queue, with the most recent report displays at the top of the list. The queue will display the last 7 days of reports, this can be configured, refer to Set the number days to retain the reports queue.
If the report is taking a while to run, Serraview will email you when the report is ready.
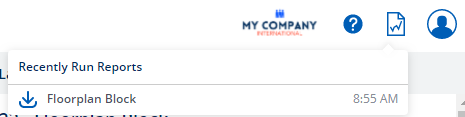
6. Click the report's name to download it. Your report will download in the bottom left corner of the browser.
All Microsoft Excel reports will open in Protected View. Click Enable Editing to be able to edit the report.