Space Activity (SVLive - Wired) Dashboard
Purpose
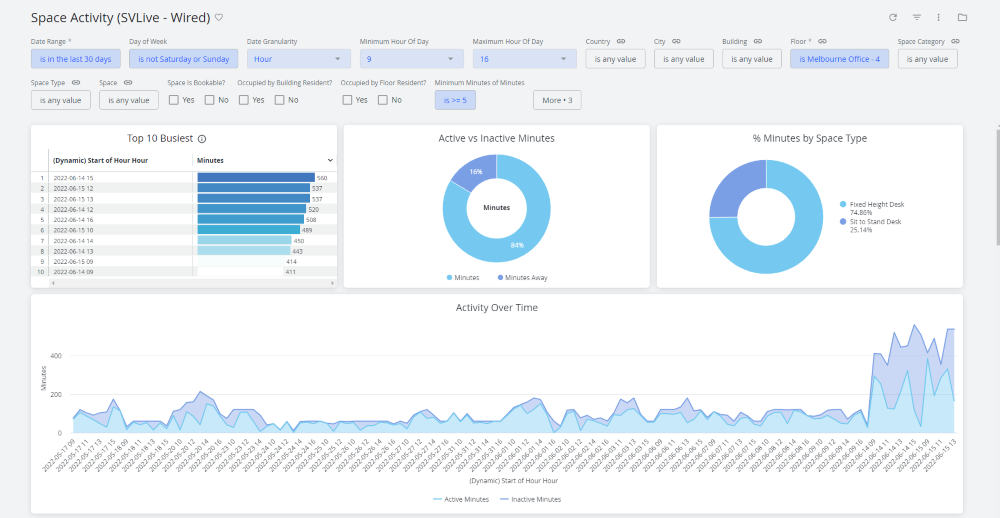
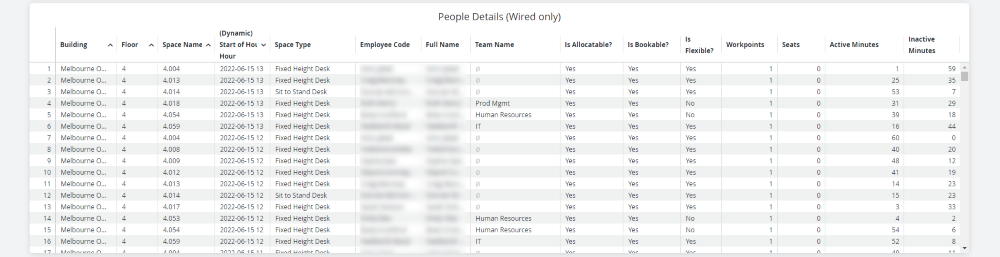
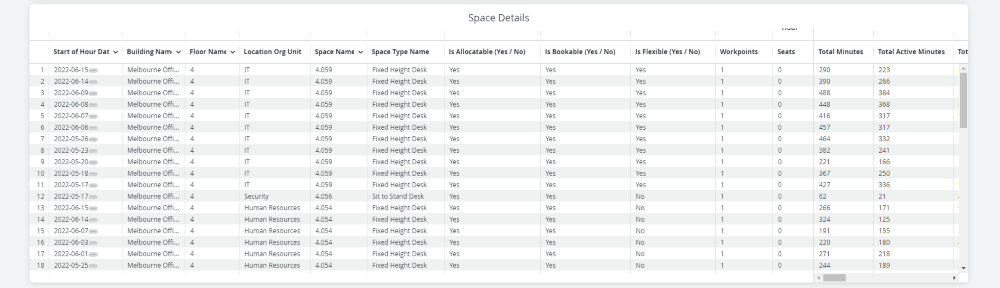
This dashboard is designed as an update to Serraview report 111, but with added details. Its focus is SVLive Wired data, breaking down how many spaces have been used, and how they have been used. The Details table breaks down each space in the date range, on each date, with a pivot that shows how much SVLive activity was picked up on each desk during each hour of that day. It also includes totals for Active, Inactive, and No Activity, explained below
Special Data Elements
- Active Minutes filter - how many minutes a user was active on a device on that desk (logged in, interacting with the device).
- Inactive Minutes filter - how many minutes the device was present at the desk, but the user was not active (screen locked or no activity picked up).
- No Activity Minutes filter - how many minutes no device was present on that desk.
Minutes in the pivot by the hour are Active Minutes + Inactive Minutes. It represents how much of that hour that desk was unavailable.
Special Filters
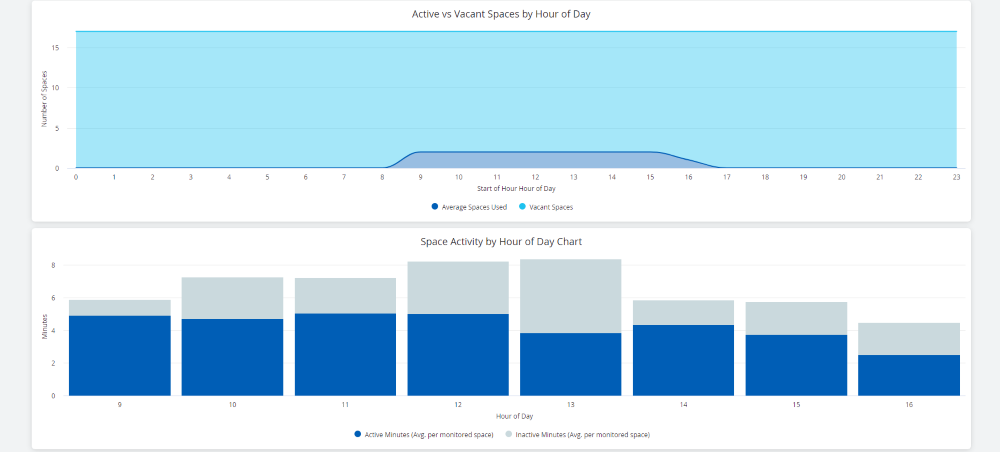
- Minimum/Maximum Hour of Day - These filters control how many hours are included in the pivot, as well as provide limiters for calculating how many ‘No Activity Minutes’ there are.
- More - Org Unit Filters - There are 3 org unit filters.
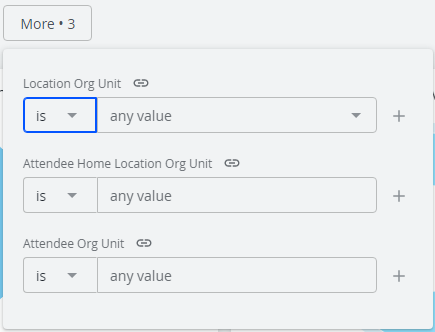
- Location Org Unit - The org unit of the space the activity was detected on.
- Attendee Home Location Org Unit - The org unit of the attendee, based on that attendees home location team.
- Attendee Org Unit - The org unit of the attendee, based on their direct org unit (as imported by finance/HR systems).
- Date Granularity: Controls the granularity level for analysis. Hour, Day, and Week are recommended.