Utilization Intensity Heatmap - Sensor Dashboard
Purpose
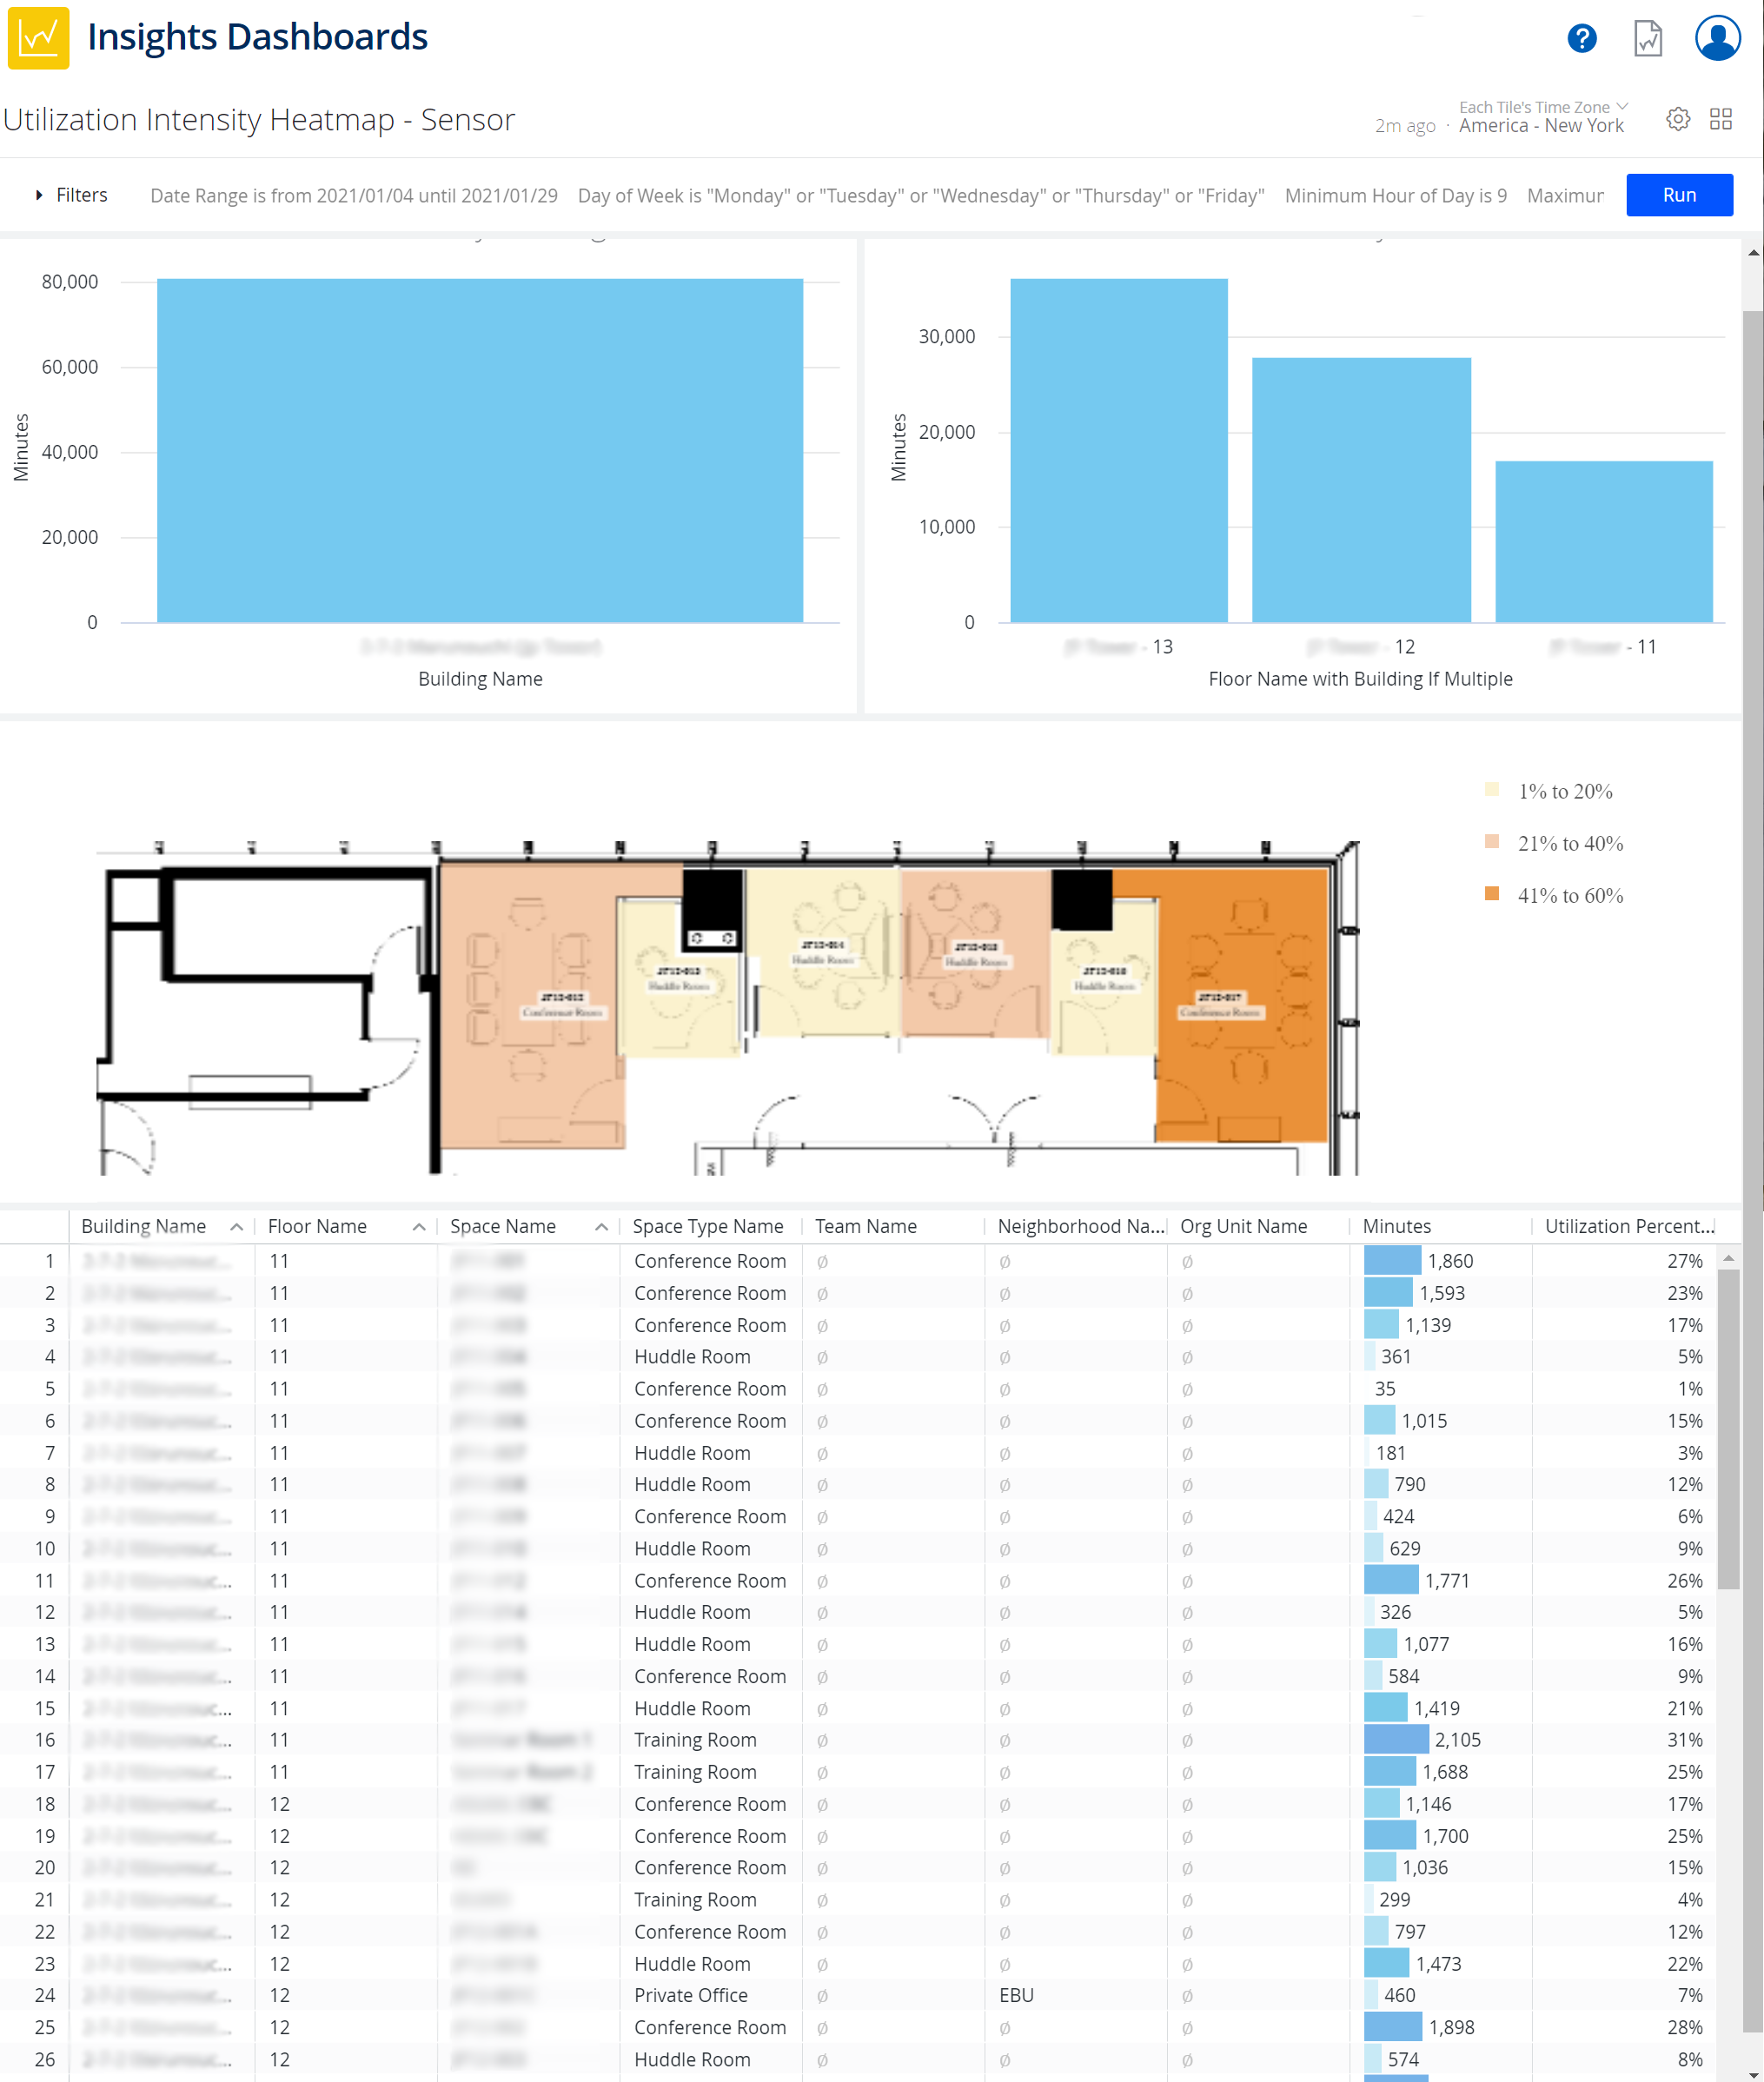
This dashboard enables Managers to visually assess the density of activity on floorplans. This can provide insight into the demand for certain types of space or arrangements of spaces with one another and other amenities like proximity to lifts, breakout areas, or various teams' locations that tabular reports on usage alone do not provide.
Special Data Elements
Minutes - Total minutes of detected use within the filtered period.
Utilization Percent - Percent of minutes' use detected out of all possible minutes.
Special Filters
- Minimum / Maximum Hour of Day filter - Use these filters to set the window of working hours within which you want to analyze space use.
Limitations
- The floorplan tile requires the selection of a single floor before it will display.