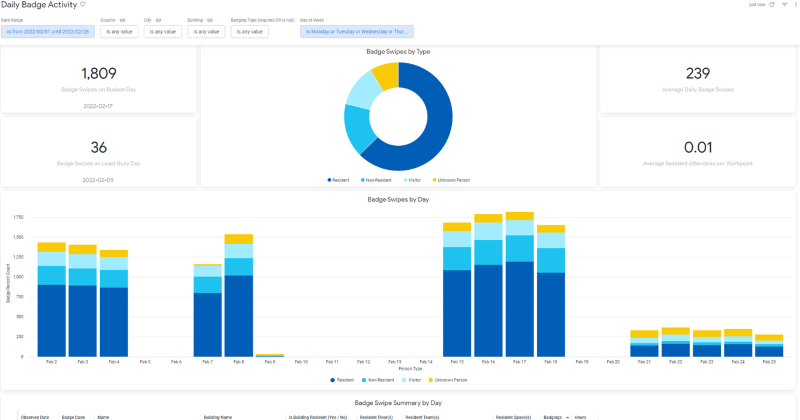
Daily Badge Activity Dashboard
- Last updated
- Save as PDF
Purpose
This dashboard gives space capacity planners a clear record of daily utilization. It depicts buildings' actual utilization across a date range via summary badge activity metrics, a plot over time showing total daily badge swipes separated by resident/non-resident/visitor status, and a detailed list of detected occupants.
Special Data Elements
-
Average Daily Badge Swipes - Average number of distinct badge swipes for all days included in the date range & days of the week filter.
-
Average Resident Attendees per Workpoint - This provides an approximate indicator of buildings' space vs occupant efficiency by dividing the average daily attendance by building residents by the total number of workpoints.
Special Filters
-
Badging Type filter - For those with more detailed badge location records, this allows filtering results to badge events within a building, e.g., to a specific team space.
-
Date Range filter - This filters records in all tiles to those having observed badge activity during the selected date range. The two summary ratio metrics at the top right of this dashboard reflect the entire date range and days of the week as set in the filter, inclusive of any days during which no badge swipes occurred. The busiest/least busy day tiles at the top left only evaluate days for which there exist one or more badge events.
-
Day of Week filter - Typically used to exclude weekends, for example, which is the default configuration for this filter. If evaluating activity at a facility that operates 7 days a week or to compare Saturday activity only, toggle values in this filter and re-run the dashboard query.
Limitations
- content
This dashboard assumes the existence of badge data in the connected business application (e.g., Serraview) for date ranges of interest.
That there might be up to a 1-day lag between badge data import and appearance on the dashboard, depending on the configured frequency of Insights ETL.

