Allocation Panel
Space
|
Label |
Description |
|---|---|
|
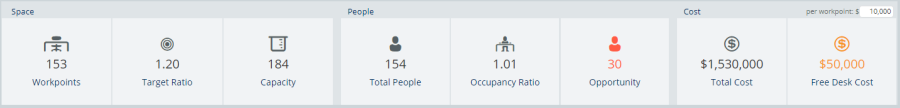
Workpoints |
The total workpoints in the portfolio or the filtered selection. |
|
Target Ratio |
The Target Ratio is the desired number of people in a team/floor/zone/hood or building compared to the number of workpoints . For example a ratio of 1.2 would mean 12 people to 10 desks. |
|
Capacity |
The total capacity for the portfolio or filtered selection. |
People
|
Label |
Description |
|---|---|
|
People |
The total people in the portfolio or filtered selection. |
|
Occupancy Ratio |
Total people divided by total workpoints. |
|
Opportunity |
The total opportunity in the portfolio or filtered selection. |
Cost
The cost per workpoint field (in the top right corner) defaults to $10,000 and you can change the cost per workpoint. If you enter the cost per workpoint as $0 then no statistic will display.
-
In the cost per workpoint field, enter the amount. The Portfolio Dashboard will automatically update.
|
Label |
Description |
|---|---|
|
Total Cost |
|
| Opportunity Cost / Free Desk Cost |
Opportunity Cost If there is utilization data then display the cost per person (calculated by total cost divided by capacity) multiplied by opportunity. Free Desk Cost The cost of free desks. Calculated by the cost per workpoints multiple by free desks. |