Daily Desk Booking History Dashboard
Purpose
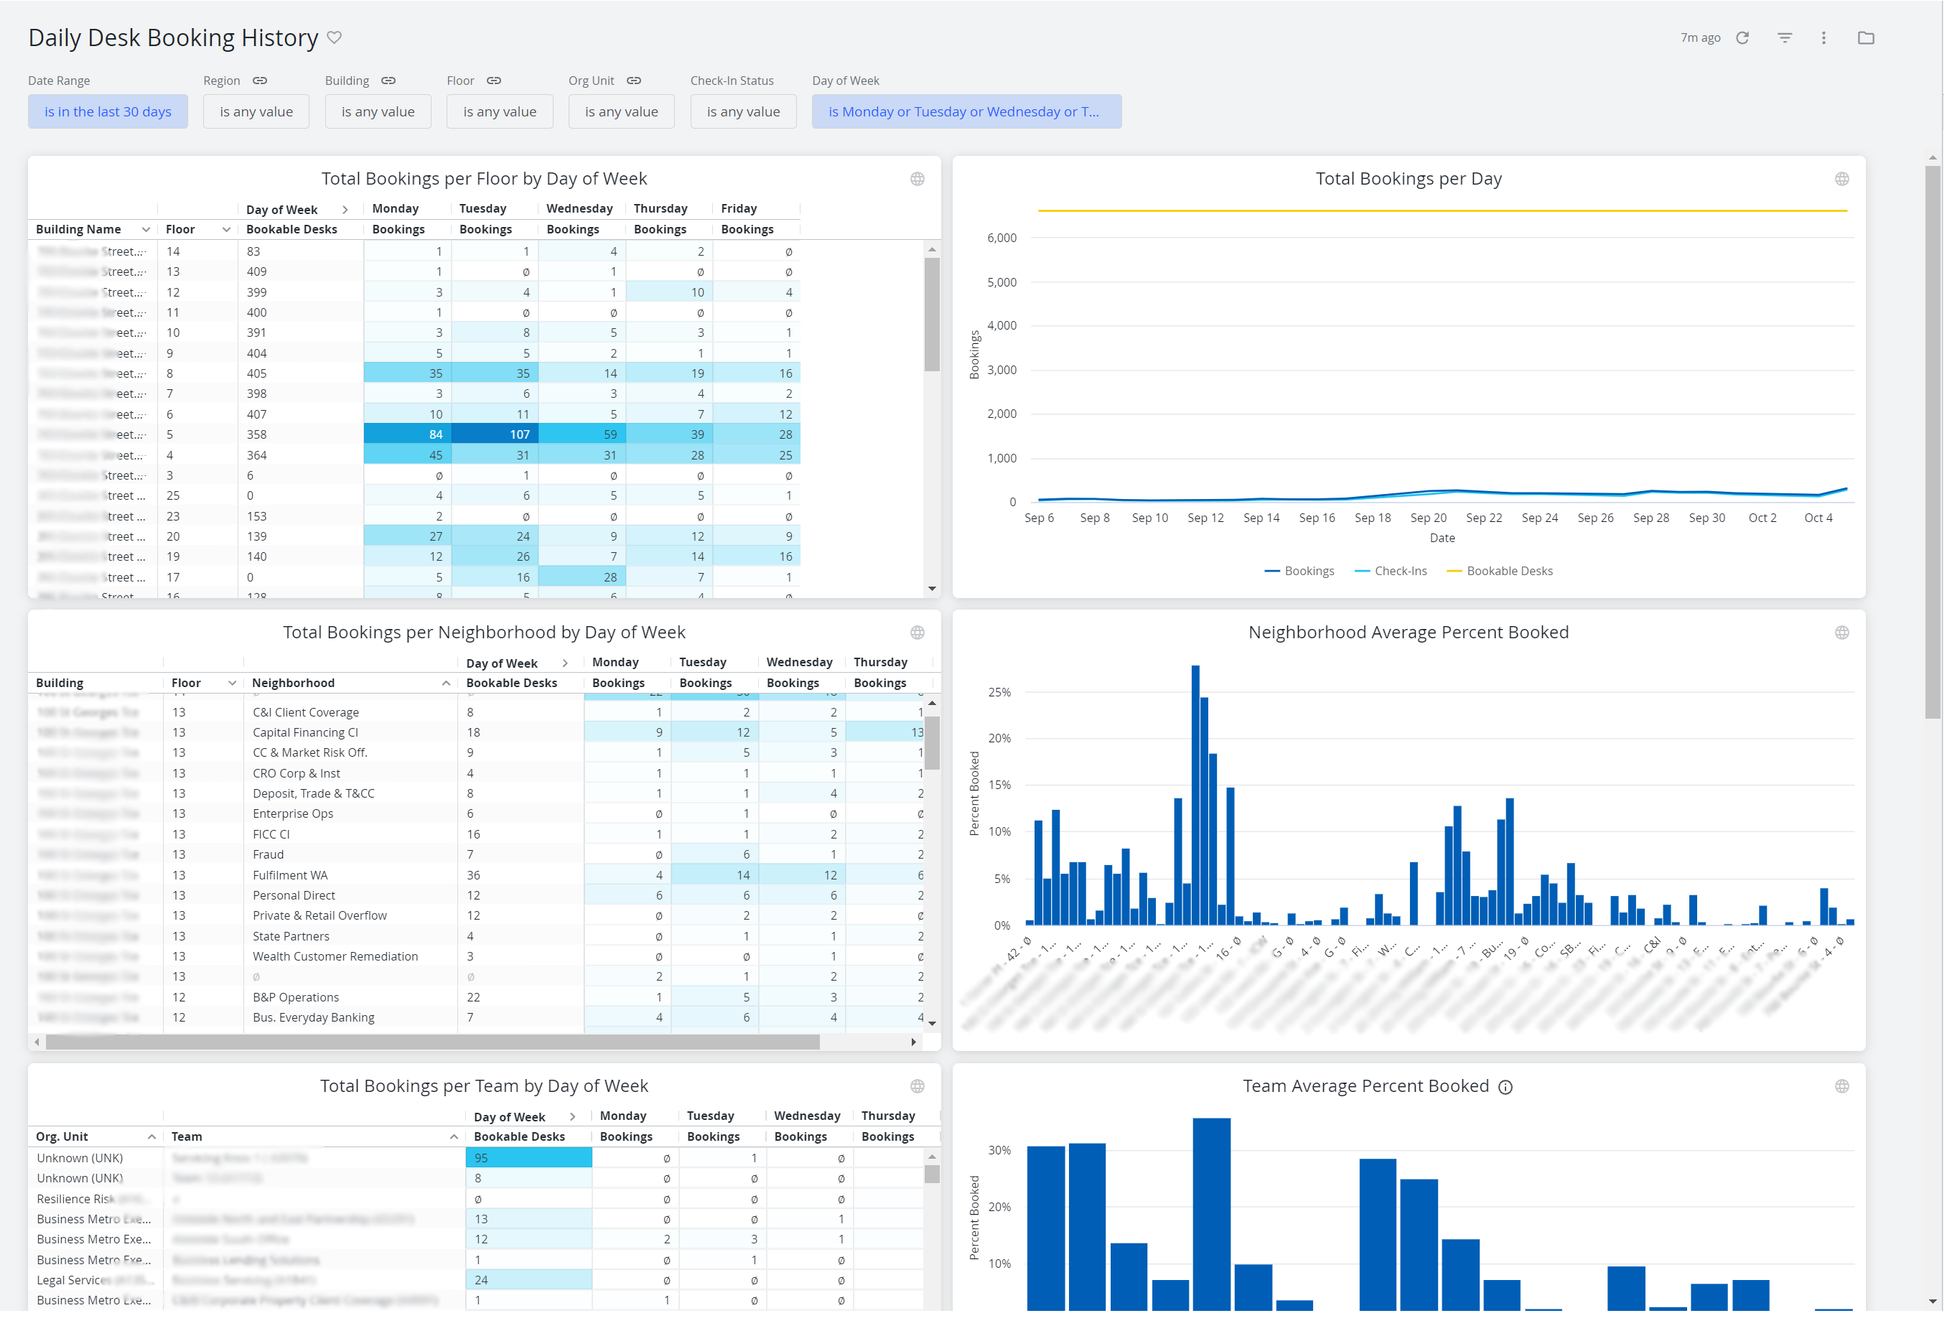
For Space Planners seeking to identify and reduce bottlenecks for desk bookings and to understand behavior patterns, the Daily Desk Booking History dashboard presents booking history for a selected date range and scope of locations. The dashboard illustrates which neighborhoods are over-booked and which ones are under-utilized.
The calendar tables on the left indicate the busiest day of the week for each floor/neighborhood/team in comparison with others. The time series plot at the top right shows total booking history over time and the number of those bookings for which attendees checked in with the Engage mobile app. Neighborhood & team Average Percent Booked charts indicate breakdowns of bookings as a percent of bookable desks.
The bottom table shows details of who booked which spaces on which dates and whether or not they checked in for their booking.
If/once filtered to a single floor and a floorplan graphic is available, a floorplan tile at the very bottom will display a floorplan indicating booked spaces.
Also, you can use the 345 Desk Booking Report to see the desk bookings made on the Engage app.
Special Filters
- Check-In Status filter - This allows users to include/exclude records from all dashboard tiles based on whether the attendee checked in. The default is to show all.
- Cross-tile filtering - This is enabled, so when you click on building or floor names in one tile will apply that selection as a filter on the entire dashboard.
Limitations
- This dashboard is designed to present ‘desk bookings’ only.
- The floorplan graphic only displays after you have the filter applied to a single floor. You can enter a value in the Floor field or click on any displayed floor name in the dashboard’s tiles and the floor will be applied as a filter.
-
The following tiles cannot be downloaded as a CSV file:
-
Total Bookings per Day
-