SVLive Essentials Dashboard
Purpose
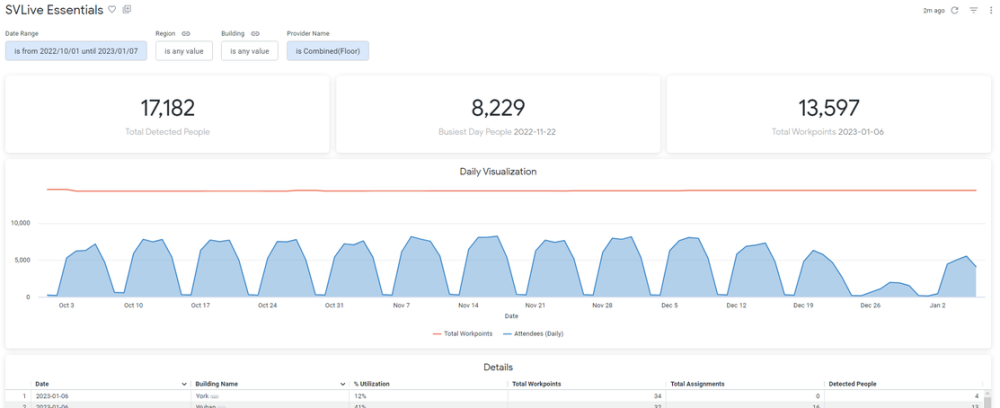
This dashboard provides the most essential information regarding SVLive. How SVLive data has been trending, how many attendees each day where detected and what each locations utilization % is included. This provides the core utilization information for making strategic decisions and creating informed occupancy plans.
For more filter options and more information regarding your SVLive data, see SVLive Building and Floor Utilization Dashboard.
Special Data Elements
- % Utilization = The detected people divided by the Total Workpoints for that day and that location
Special Filters
- Provider Name - This control lets you adjust which SVLive sources populate the charts. You can swap between wired and wi-fi, or combined. All versions of Combined are identical for this dashboard, and will not double count people detected on both wired and wifi.
Limitations
-
The following tiles cannot be downloaded as a CSV file:
-
Daily Visualization
-
Details
-