ETL Status Dashboard
Purpose
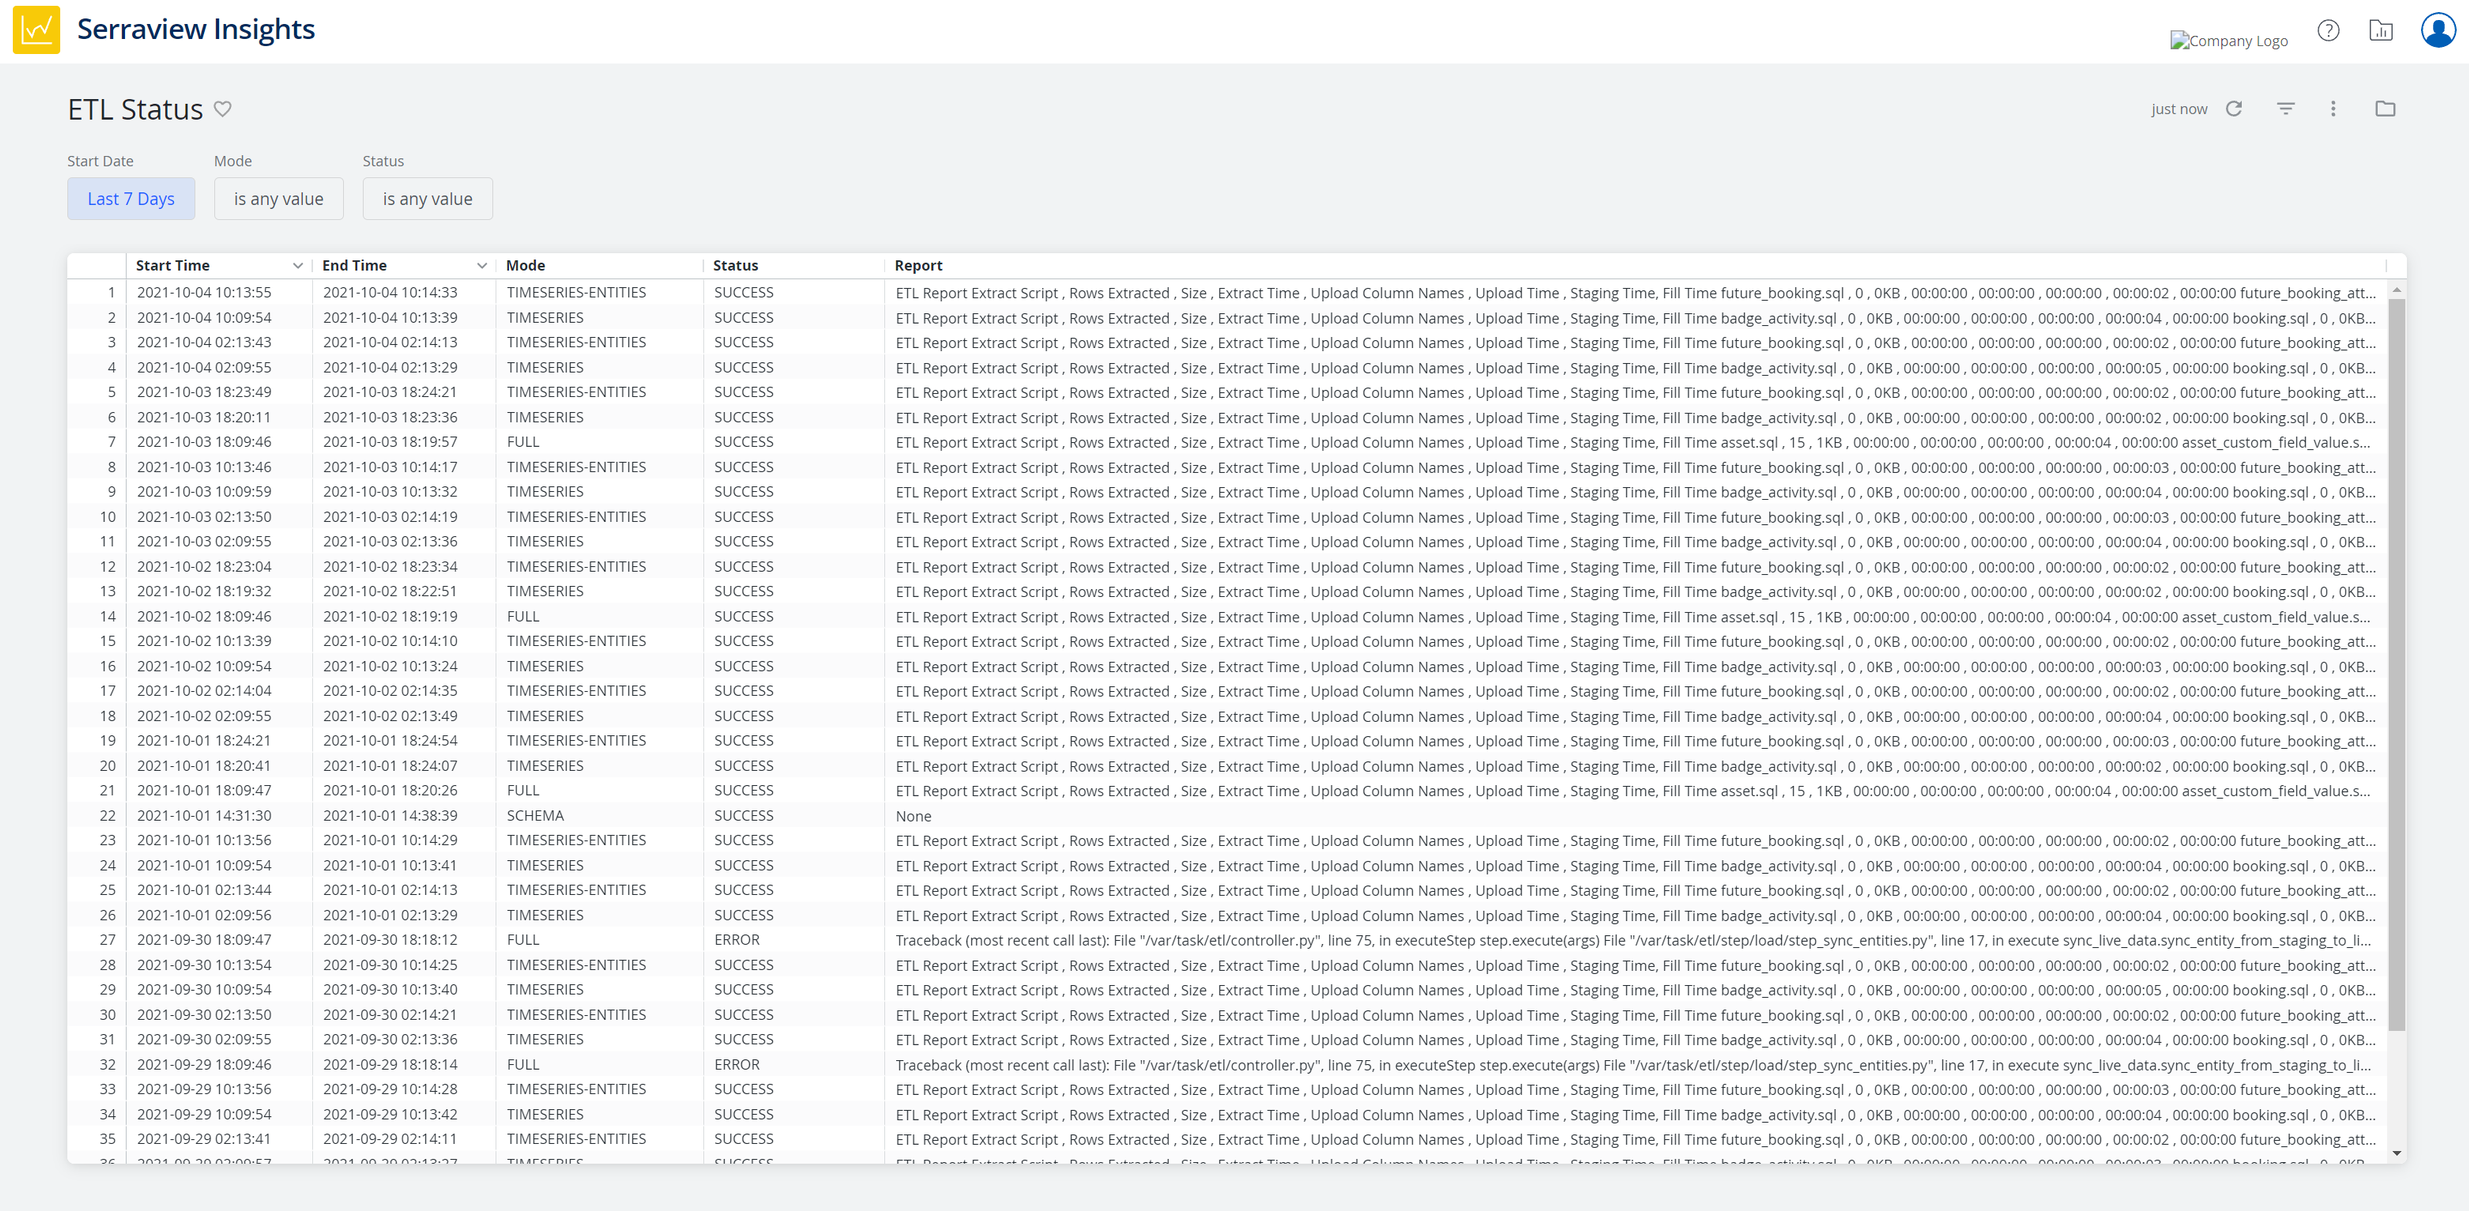
This shows the status of Insights' recent Extract Transform and Load (ETL) events, confirming the currency of data within Insights with respect to the source application(s). This can be especially useful for timing scheduled runs of time-sensitive outputs as well as for monitoring the progress of a new deployment, wherein initial data loads can progress over the course of several hours or days depending on the volume and number of years of preceding data Insights is ingesting. After the initial load is complete, you can expect to see a regular cadence of nightly “Full” runs and, depending on configuration, a series of “Timeseries” runs in between.
In general, as a matter of configuration for each client instance, time-series ETL processes new incoming data every hour and a full ETL of all other entities and metrics occurs nightly. If your instance is not configured as expected (e.g., you know you have current booking data but it’s not appearing in a dashboard where it should), then this dashboard will make that readily apparent. In the unlikely event of errors (depicted above), this dashboard can speed the resolution process via the Support team.
Special Data Elements
-
Mode - Denotes the type of operation Insights is performing.
- FULL is the full nightly run that processes any deltas across your entire data set from the parent application.
- TIMESERIES-ENTITIES is where Insights ensures the entity records involved in the next set of time-series records are up to date.
- TIMESERIES is the processing of the actual time-series values themselves, e.g., from badge, bookings, sensors, or SVLive sources.
-
Report - Contains some details about each respective ETL run, mostly of interest to Insights developers, but can be useful for inspecting data throughput, e.g., is the volume of changes in accord with what we would expect from our ongoing transactions?