Daily Spaces Used - Last 30 Days Dashboard
Purpose
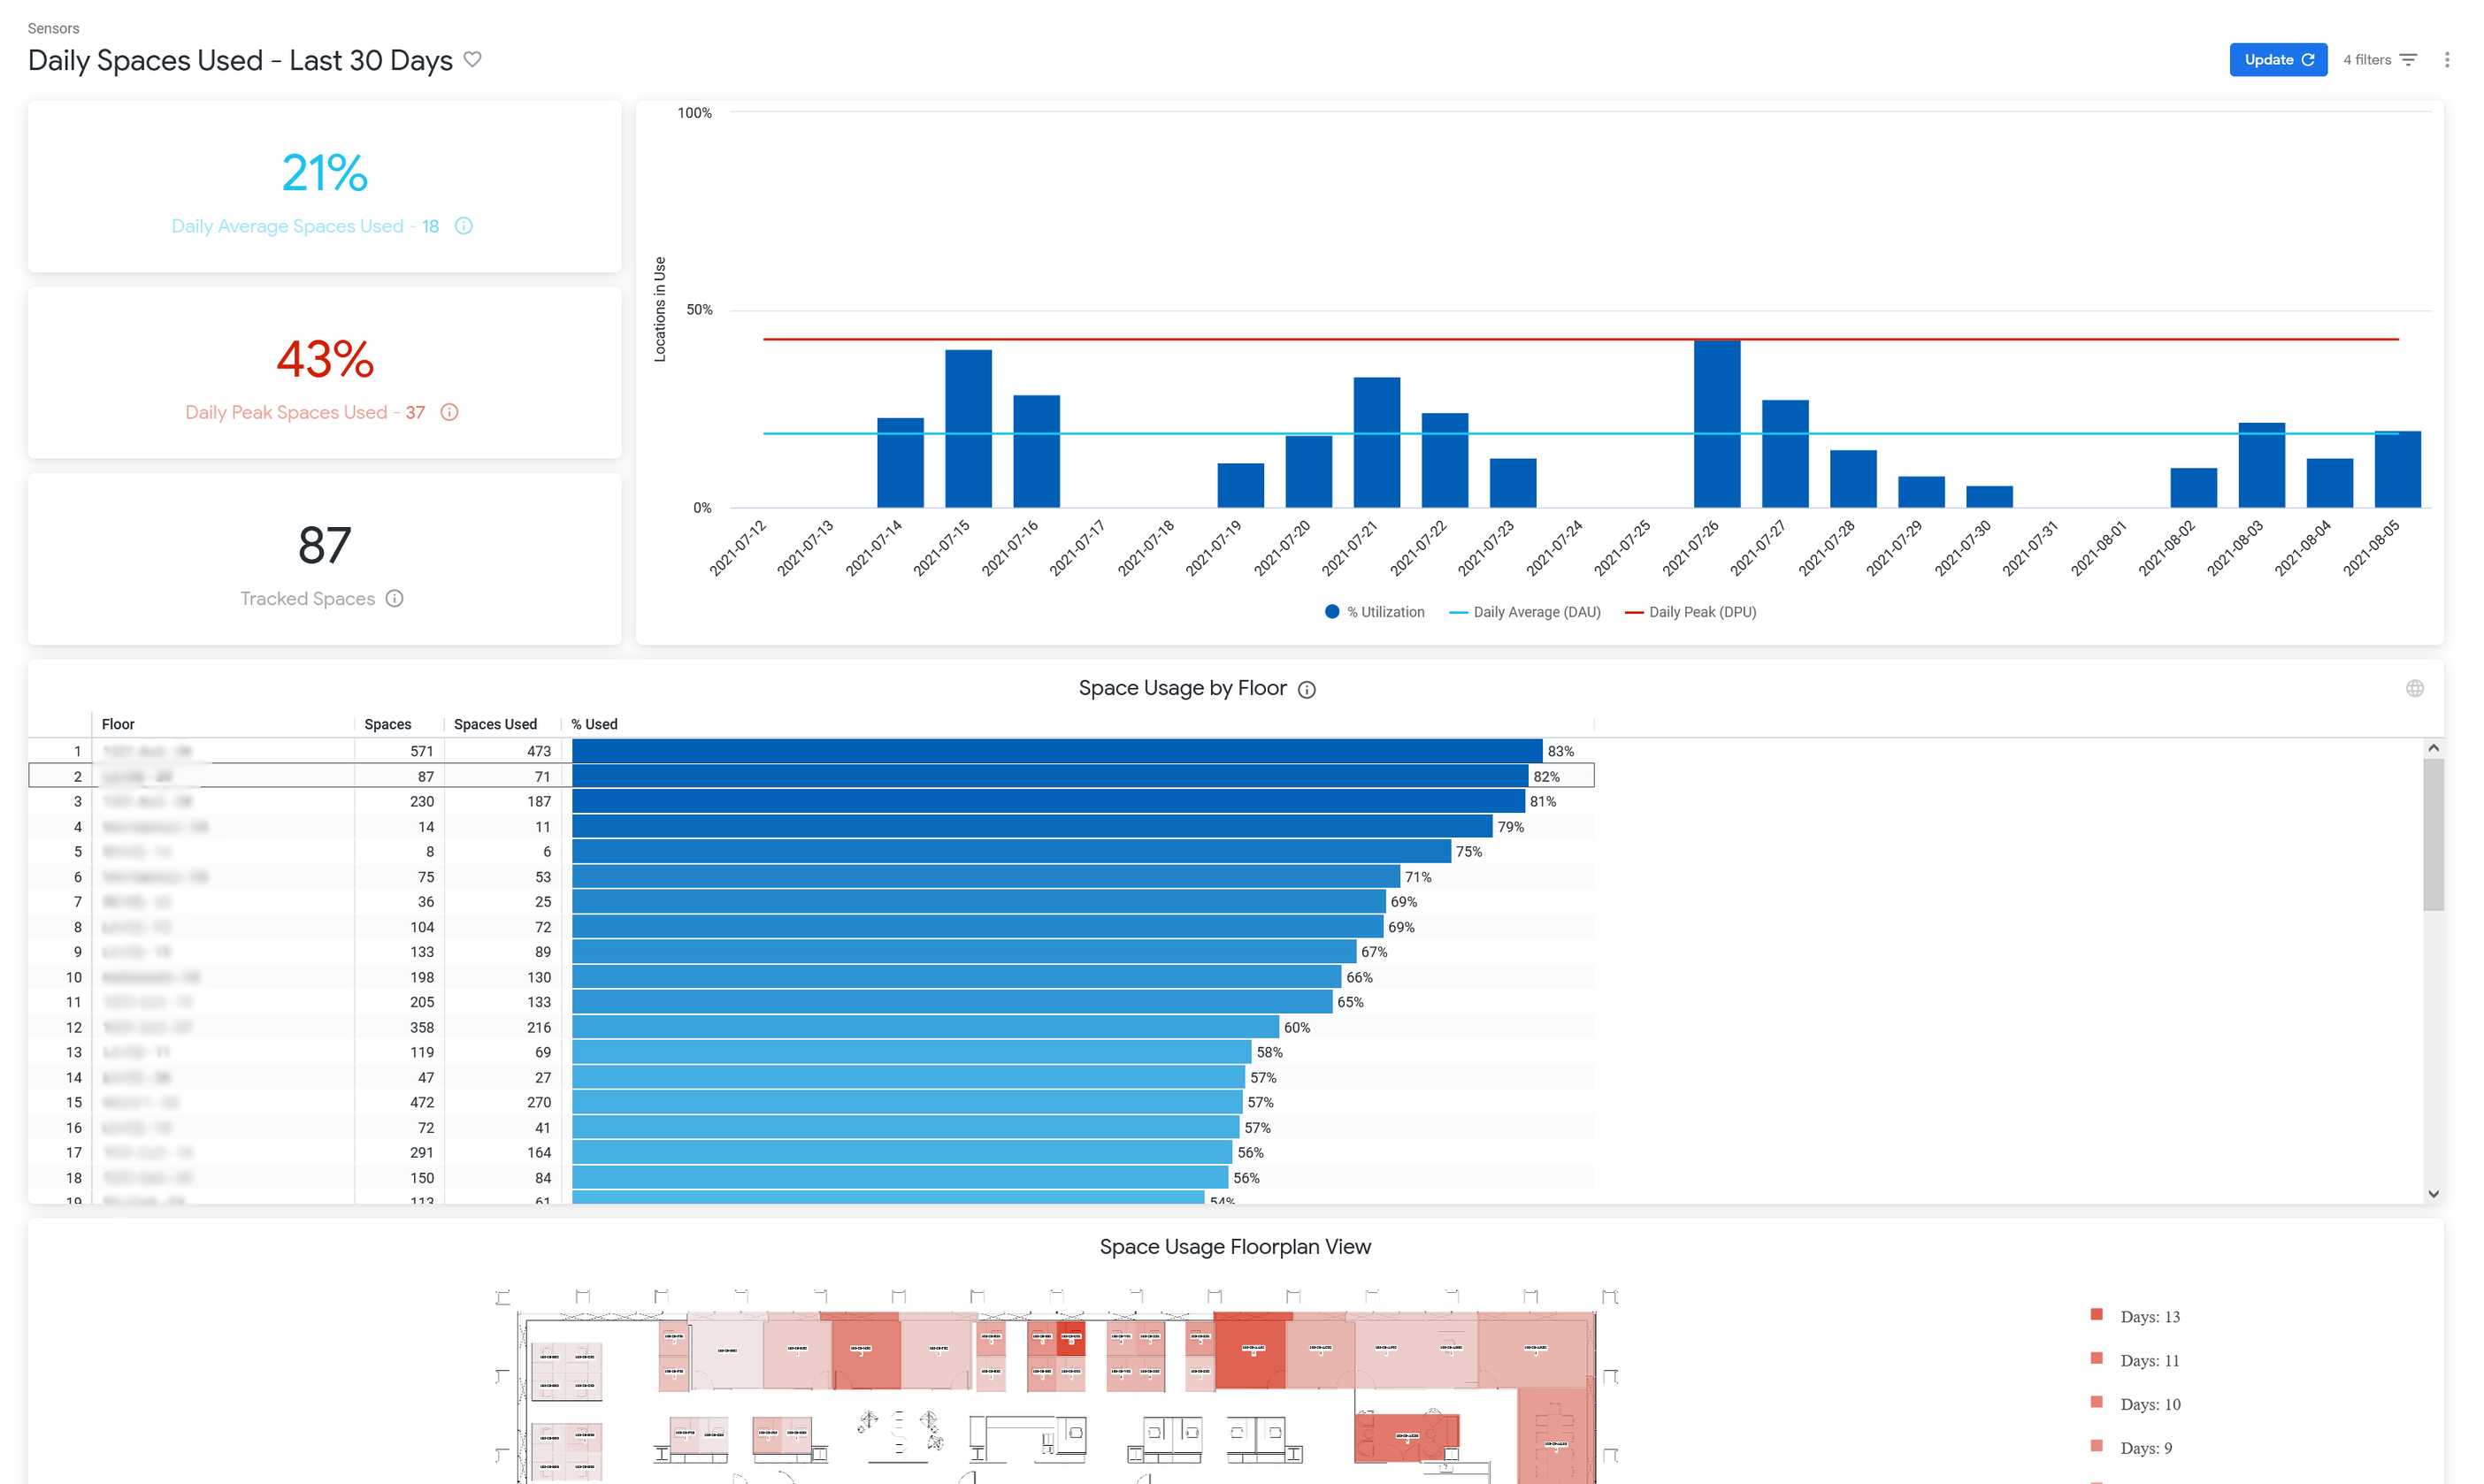
This dashboard summarizes key sensor-based utilization metrics in one place for Space Planners to quickly glean an understanding of recent utilization. The default perspective starts portfolio-wide, but can be readily filtered to one or more buildings. You can click on any floor name that displays a floorplan view with a sensor-based heatmap that shows the most used spaces.
Special Data Elements
Daily Average Spaces Used - The average percent of sensor-tracked spaces in use across all days of the date range.
Daily Peak Spaces Used - The maximum number of locations in use during any single day in the date range divided by the number of tracked spaces.
Tracked Spaces - These are all spaces identified as having sensors, whether online or offline during the date range.
Special Filters
Cross-tile filtering enabled. Click on any individual date in the date series chart to filter the dashboard to that day’s values. Click on any floor in the Space Usage by Floor tile to open that floor’s heatmap.
The dashboard excludes weekends from metric calculations.
Limitations
- Requires sensor data.