Navigate Portfolio Dashboards
- Last updated
- Save as PDF
The Portfolio Dashboards is accessed via:
- From the left-menu, click Insights > Portfolio Dashboard.
- To return to the Landing page, click the Landing page
 icon in the top-left.
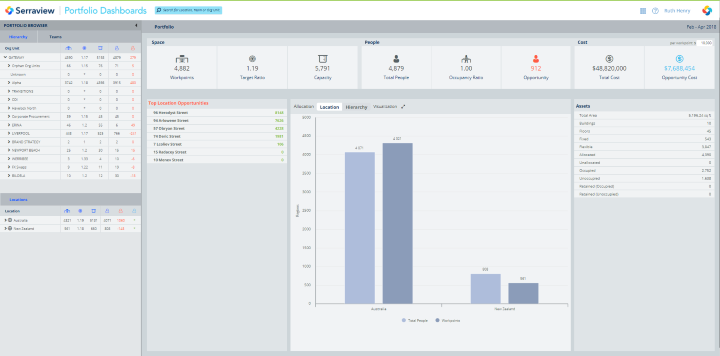
The example below displays the data for the portfolio.
Hover on the image and then click to go directly to the content.

Portfolio Dashboard contains the:
Portfolio Browser Panel
- Portfolio Browser Panel contains filters for Hierarchy, Teams, and Locations. The filters represent a different way of filtering the data.
Portfolio Dashboard Information Panel
- Portfolio Dashboard Information Panel contains the filter results for the Hierarchy, Teams, and Locations filters. The panel contains the following:
- Allocation Panel contains information about Space, People, and Cost.
- Utilization Panel only displays when there is utilization data available for all the floors. For example, if you have selected a building, the Utilization Panel will display only if all the floors of the building have utilization data.
- Top Opportunities Panel displays the top opportunities for locations and teams.
- Residents and Non-residents Panel.
- Allocation Visualization Panel contains a bar chart that displays the number of Total People and Workpoints filtered by Location or Org Unit.
- Assets Panel displays the total area of the portfolio (or the selection of Org Unit and Location), the number of buildings, the number of floors, and the number of seats in the portfolio, region, or location.
Search
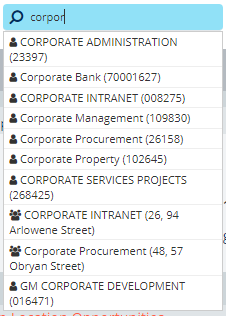
You can search for a location, team, or org unit.
![]()
- In the search field, enter the search criteria, and the auto-complete list displays.
- From the auto-complete list, select an item. The Portfolio Dashboard updates.

Portfolio Dashboard Update Frequency
The data presented in the Portfolio Dashboard updates whenever the page is refreshed.
