Accommodations Summary Dashboard
Purpose
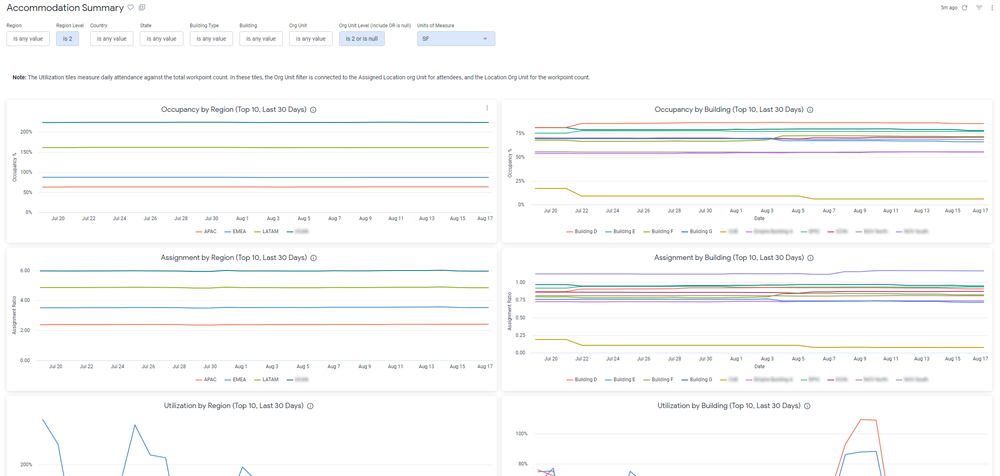
This dashboard provides a thorough summary of your entire portfolio and how it has been performing over the last 30 days. Similar to the 130 Accommodation Summary report, all of your summary property information is contained within the Details tile. Utilization and Assignment trends are included, limited to the top 10 in each case. This report can serve as a starting point for exec-level information, and with good filter selection you set this dashboard up to only show relevant locations.
Special Data Elements
- Utilization % and Assignment Ratio - Tooltip icon has the calculation.
Special Filters
- Region Level - Affects the level of region that is used to group the data. This DOES impact the Region filter, so set this first.
Limitations
- All line-graph tiles are limited to top 10, for 30 days. This is to maximize readability and performance.