View Block and Stack's Information Panel Statistics
- Last updated
- Save as PDF
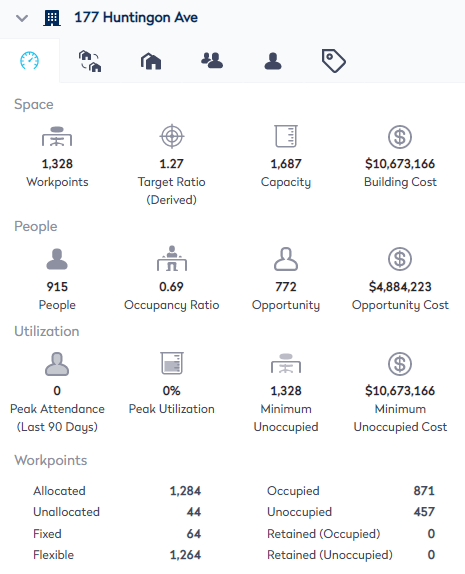
The Overview tab displays the VBS statistics and it is context-sensitive, which means it displays information based on your selection in the block and stack. If nothing is selected, then the statistics display for the building.
From the VBS complete the following:
- Use the Location Selector to select a building.
- By default, the building
 icon is selected and the Information Panel displays the building statistics.
 - Select either the floor, neighborhood(s), team(s) to view their statistics in the Information Panel.
The example below is for a building.

Space
|
Label |
Description |
|---|---|
|
Workpoints |
The total amount workpoints. A space's total workpoints are not counted when the Charge Rule's Allow org unit allocation checkbox is unchecked. For more details, refer to Charge Rules. |
|
Target Ratio / |
Target Ratio The Target Ratio is the desired number of people in a team/floor/zone/neighborhood or building compared to the number of workpoints. For example, a ratio of 1.2 would mean 12 people to 10 desks. Derived Target Ratio If there are different target ratios in the VBS, then the target ratio is the Derived Target Ratio. This is calculated as (capacity divided by total workpoints). |
|
Capacity |
The total capacity for the selection calculated at the team level. The unallocated workpoints will use the default target ratio for the floor. |
|
Building Cost |
The chargeable cost of the building. This is added via the Building Form on the Overview tab, refer to Add, Edit, or Delete a Building. |
People
|
Label |
Description |
|---|---|
|
People |
The number of people assigned (to a desk or team). A space's total people are not counted when the Charge Rule's Allow org unit allocation checkbox is unchecked. For more details, refer to Charge Rules. |
|
Occupancy Ratio |
The ratio of assigned people and the retained (occupied) workpoints to total workpoints. |
|
Opportunity |
The capacity minus the number of assigned people and retained (occupied) workpoints. |
|
Opportunity Cost |
The opportunity multiplied by building cost divided by building capacity. |
Utilization
Utilization statistics are based on Badge Swipe data (Speedgate data) or SVLive data. If you do not have Badge Swipe data (Speedgate data) or SVLive data within your portfolio you may not see these statistics at all, or the statistics will display a zero count.
The default is set at the portfolio level in the Configure Utilization for VBS - Information Panel settings and if needed this can be overridden on a per building basis, refer to Add, Edit, or Delete a Building.
|
Label |
Description |
|---|---|
|
Peak People |
The total number of (assigned) people detected as the busiest on one day in a given time period. This will depend on the configured data source. The time period is set in the Configure Utilization settings, refer to Configure Utilization for VBS - Information Panel. |
|
Peak Utilization |
Peak people divided by total workpoints and displayed as a percentage. |
|
Minimum Unoccupied |
The number of workpoints minus the peak people. |
|
Minimum Unoccupied Cost |
The minimum unoccupied multiplied by the cost per workpoint. |
Workpoint Breakdown
|
Label |
Description |
|---|---|
|
Allocated Unallocated |
The number of workpoints allocated to a team. The number of workpoints without a team allocation. |
|
Occupied Unoccupied |
The number of workpoints assigned to a person or are retained (occupied) desks. The number of workpoints not assigned to a person or are retained (unoccupied) desks. |
|
Fixed Flexible |
The number of workpoints that have a fixed working style. The number of workpoints that have a flexible working style. |
|
Retained (Occupied) Retained (Unoccupied) |
The number of retained desks that count as occupied. The number of retained desks that do not count as occupied. The Retention Statuses can be configured to count as occupied, for more information on the configuration refer to Retention Statuses. |
