2022 March Insights Product Release
Reminder
Dashboards that contain a table will only display up to 500 rows, when you want to download all of the data to a file, such as a CSV, Excel, etc then you will want to increase the rows. Hover on the table and click the More Actions  icon and then click Download Data. In the Download dialog, click the Advanced data options and then select the Custom option which will increase the rows to 5000. Now that you are ready to download all the data, click the Download button.
Learn more in Download a Single Table.
Insights Editor
Released March 17th
Insights Editor updates include:
- Updated the Total Days in Measure to accurately allot the total days in a selected date range by any date fields which are included in the query. This measure is found in the Utilization explores.
Released March 2nd
Insights Editor updates include:
- Added Workpoint Cost field to the Building Metrics View.
- Added Archived Date field to the Person view.
- Added Workpoints Stacked field to the Floor Metrics view.
- Added Approval Count field to the Service Request Person view.
- Added Count field (booking check-in count) to the Booking view.
- Added Assigned Person view to all Utilization explores.
- Removed Booking (Canceled) explore as the measures and fields are now found in the other Booking explores.
Dashboards
Released March 31st
- NEW Combined Utilization Summary Dashboard - This dashboard shows and combines utilization sources, including Bookings, Badge, and SVLive. This is extremely useful for clients that have multiple data sources, and want to understand what their Utilization is when such data is combined. The way it works is; if a person has appeared in SVLive and Badge, they will only count as 1 person for the purpose of Busiest Day, Average Day, and Daily Visualization. Someone who only appeared in 1 of those sources would also count as 1.
- RENAMED Booking Compliance Dashboard renamed to Utilization Compliance Dashboard - As business returns to normal, ensuring compliance with return-to-work rules is critical for the safety of all staff. This report helps track breaches of these rules, tracking both staff no-shows as well as staff showing up but with no booking. Even without booking data, this dashboard can identify staff who attended the building in the case of any COVID-19 risks.
- RENAMED List of Spaces by Day with Badge Status Dashboard to List of Spaces by Day with Badge Status Dashboard - This dashboard gives space capacity planners a clear record of daily utilization. It depicts buildings' actual utilization across a date range via summary badge activity metrics, a plot over time showing total daily badge swipes separated by resident/non-resident/visitor status and a detailed list of detected occupants.
- UPDATED Daily Desk Booking History Dashboard - Enhancement to include future bookings.
- UPDATED Daily Badge Activity Dashboard - To be renamed to Daily Badge Activity dashboard. Minor cosmetic changes to improve the clarity of meaning. Also, improved two metrics calculations for utilization averages. Average per day now includes all days that fall within the filters' constraints, whereas previously days with zero badge-ins would not be considered when averaging daily badge activity.
Released March 17th
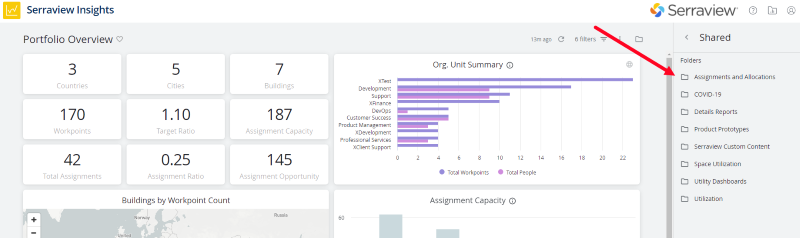
New Folder Structure
As the list of dashboards has grown, therefore it's time for a restructure of the folders. Below are details of the changes:
| New Name | Existing Name |
|---|---|
|
CHANGE Assignments and Allocations - to contain all existing dashboards |
Seating Assignments and Allocations |
|
SAME COVID-19 - to contain all existing COVID-19 dashboards. |
COVID-19 |
|
SAME Details Reports - to contain all dashboards that are a single tile of tabular data. |
Details Reports |
|
SAME Utility Dashboards - to contain all the existing utility dashboards. |
Utility Dashboards |
|
CHANGE Utilization
|
Bookings & Reservations Space Utilization
|
Insights Dashboard updates include:
- NEW Combined Utilization Summary Dashboard - This dashboard shows and combines utilization sources, including Bookings, Badge, and SVLive.
- NEW Service Request Summary Dashboard - This dashboard provides a top-down summary of how service requests have been progressing within the time range.
- NEW Meeting Room Summary Dashboard - This dashboard provides users with the most fundamental data needed for meeting room analysis. Breakdowns by the hour, space type, attendees are all included. This information can help inform strategic decisions surrounding meeting rooms.
- NEW Meeting Room Bottlenecks Dashboard - When it comes to analyzing meeting rooms, the first step is identifying problems and success criteria. This dashboard serves to do both.
- NEW Service Request Daily Snapshot Dashboard - This service request focused dashboard provides a quick highlight of the current state of service requests. Current unresolved requests, upcoming planned dates, and recently resolved requests are all on display. All this information will help MAC managers keep on top of service requests and identify what dates to plan moves for service requests in progress.
- NEW Users and Roles Dashboard - This utility dashboard contains security and user information needed to manage the Serraview platform. This can be used for audit and platform management purposes.
- UPDATED Badge Building Utilization Dashboard - Enhancement to use counts instead of percentage.
- UPDATED Booking History Details by Space Dashboard - Enhancement to include new check-in and check-out columns in the details table.
- UPDATED Portfolio Overview Dashboard - Enhancement to the Region filter so that it filters on a selected region and includes all its hierarchical descendants.
Released March 2nd
Insights Dashboard updates include:
- NEW Service Request Details Dashboard - A tabular dashboard, designed with the option of exporting to CSV or Excel (use Explore From here to export to Excel). This dashboard includes all Service Requests and their associated Space Requests. To and From information is included, as well as relevant dates, types, and status. This information can be data validation, communication, and detailed planning. Guarantees at least 1 row per Service Request, and 1 row per Space Request. A Service Request may have 0 or many Space Requests.
- UPDATED Space Details Dashboard was enhanced to included new filters to the dashboard.
- UPDATED Renamed List of People and Assignments Dashboard to People and Assignments Dashboard. This dashboard will include visualizations.
-
UPDATED Renamed from Building Area Breakdown Dashboard to Area Breakdown Dashboard. This dashboard will now include visualizations.
- UPDATED Booking Compliance Dashboard the following has been improved:
- Descriptions for each state of utilization in the legend of the bar chart tile in the Booking Compliance dashboard, and color-coded each state to reflect their desired/undesired nature. Additionally, the following tiles was added:
- the counts of daily attendees which fall under summarized states (booked but not detected, detected but not booked, booked and detected)
- a pie chart that displays the prevalence of a particular utilization source over the specified time period via percentage.
- a bar chart grouped by weekday which aggregates daily attendance by utilization source
- Descriptions for each state of utilization in the legend of the bar chart tile in the Booking Compliance dashboard, and color-coded each state to reflect their desired/undesired nature. Additionally, the following tiles was added:
- REMOVED Canceled Bookings Dashboard - Previously the canceled bookings were only accessible as a separate data set and now the canceled bookings appear in the historical, future, and all bookings explores and related dashboards. Therefore we will remove the now-redundant Canceled Bookings explore to improve clarity and usability. Remember it is possible to query and build dashboards that only show canceled bookings using the combined explores via filtering, so no functionality is lost. Also, we have found that customers want to compare canceled bookings with non-canceled bookings.