Building Stack: Ratio Seating Performance Dashboard
Purpose
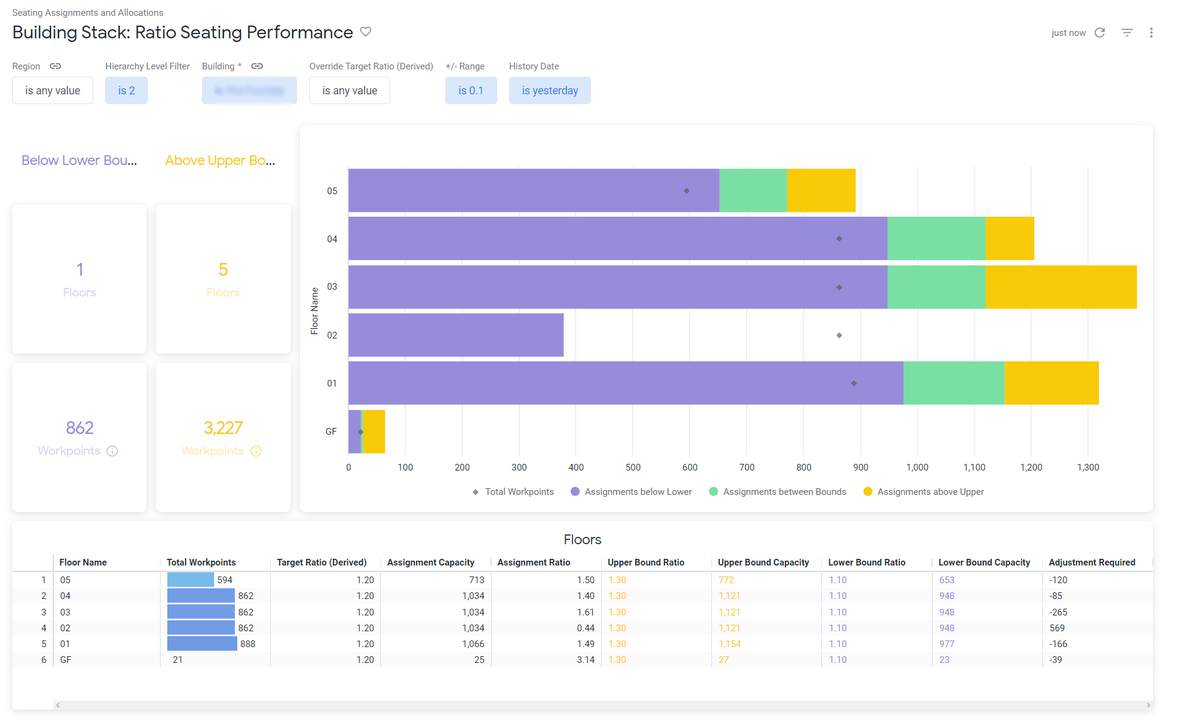
This dashboard analyzes your buildings' floors' occupancy ratios according to your target ratios. The +/- range lets you define the ‘sweet spot’ for occupancy planning. The dashboard presents a visual ‘stack’ of your building and highlights those floors that fall outside your prescribed target ratios. Use this dashboard to guide you toward actions to bring space use into conformity with your targets.
You can also override your prescribed ratios with the Override Target Ratio parameter. For example, you might set a maximum ratio of .6 to ensure safe spacing, or, in a highly leveraged, agile workplace you might set your upper limit to 1.2.
In either case, this dashboard identifies outliers and tells you the number of assignments to add/remove from each floor to meet your goals.
When this dashboard is edited in the Insights Editors then you can enable cross-filtering, see Looker's documentation article called Cross-filtering Dashboards.
Special Data Elements
-
Target Ratio (Derived) - A weighted average of the Target Ratios within the Building/Floor
-
Upper/Lower Bound - The bounds for determining outliers. Buildings & floors with an Assignment Ratio above the Upper Bound or below the Lower Bound will display in the Action Lists and Charts.
Special Filters
-
Override Target Ratio - When left blank, uses each building and floors Target Ratio (Derived). This may be different per building and floor. These values can be overwritten for this dashboard by entering an override, such as 1.2.
-
+/- Range - The range for determining outlying data. Increasing this value will increase the upper bound and lower the lower bound. Buildings and floors outside these bounds are highlighted across this dashboard