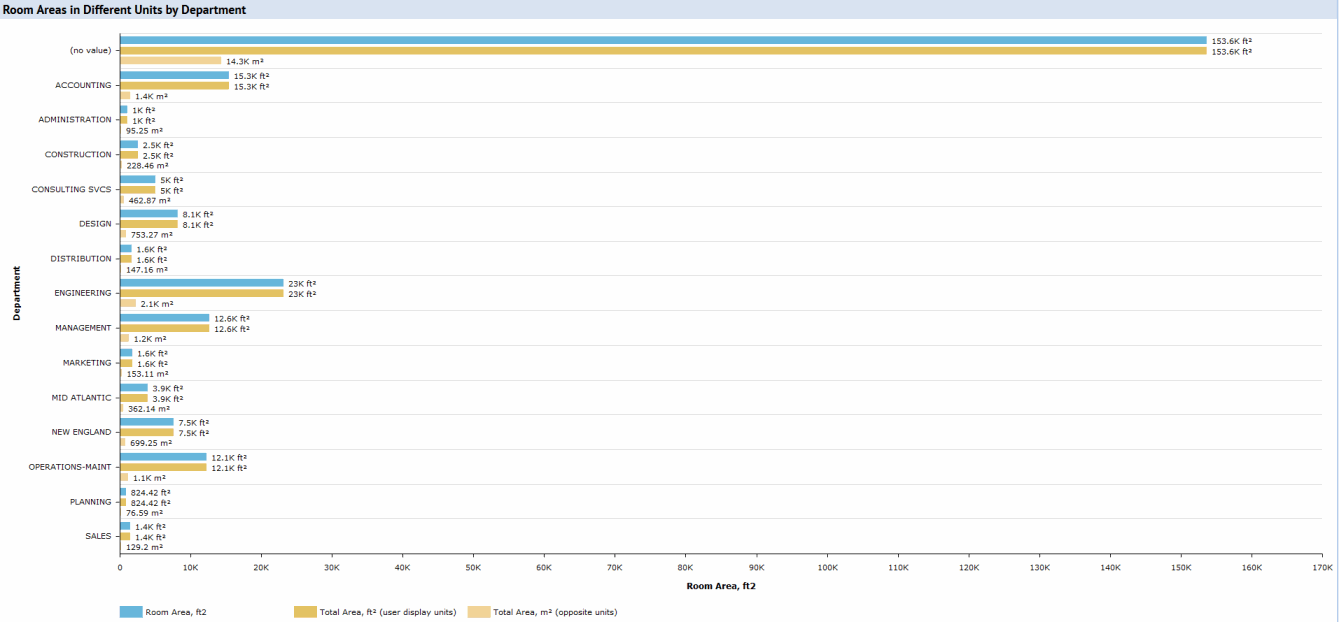
Show a chart with different units
HTML Chart Control
Show a chart with different units
Technologies > User Interface Add-Ins > HTML Chart Views > Unit Expressions
When
showUnitPrefixes
is set to true, all big numbers will convert to small numbers appended with “K,M,G” unit key for all
dataAxis
. The unit key is added dynamically. Default is true.
The unit key can be different based on the number value.
When
showUnitSuffixes
is set to true, for the data axis fields with numeric format of area/length, the corresponding area/length unit is added to the data values dynamically in tooltips and data labels. However, the axis labels does have the unit suffix. Default is false.
<view version="2.0"> <title>Units Expressions: User display units=[${user.displayUnits}], area title=[${user.areaUnits.title}], area opposite title=[${user.areaUnits.oppositeTitle}], area conversion factor=[${user.areaUnits.conversionFactor}]</title> <dataSource id="exUnitsTotalsDS" type="grouping"> <table name="rm"/> <field name="dp_id" groupBy="true"/> <!-- Default: displays area in User Units. --> <field name="area_total1" baseField="rm.area" formula="sum" dataType="number"/> <!-- Same as above, with User Units set explicitly. --> <field name="area_total2" baseField="rm.area" formula="sum" dataType="number" numericFormat="area"/> <!-- Displays area in Opposite Units (whatever is the opposite of the User Units). --> <field name="area_total3" baseField="rm.area" formula="sum" dataType="number" numericFormat="oppositeArea"/> </dataSource> <panel id="exUnitsChart" type="htmlChart" controlType="barChart" dataSource="exUnitsTotalsDS" showDataTips="true" showLabels="true" showUnitPrefixes="true" showUnitSuffixes="true"> <title>Room Areas in Different Units by Department</title> <groupingAxis table="rm" field="dp_id" dataSource="exUnitsTotalsDS"> <title>Department</title> </groupingAxis> <!-- Default: Displays area in User Units. Displays the base field title. --> <dataAxis table="rm" field="area_total1" dataSource="exUnitsTotalsDS"> <title>Room Area, ft2</title> </dataAxis> <!-- Same as above, but with a custom title. --> <dataAxis table="rm" field="area_total2" dataSource="exUnitsTotalsDS" displayAxis="false"> <title>Total Area, ${user.areaUnits.title} (user display units)</title> </dataAxis> <dataAxis table="rm" field="area_total3" dataSource="exUnitsTotalsDS" displayAxis="false"> <title>Total Area, ${user.areaUnits.oppositeTitle} (opposite units)</title> </dataAxis> </panel> </view>
The resulting view appears as below:

Example view: http://localhost:8080/archibus/schema/ab-products/solutions/parts/htmlchart/ab-ex-htmlchart-units.axvw
