Display multiple axes in a chart
HTML Chart Control
Display multiple axes in a chart
Technologies > User Interface Add-Ins > HTML Chart Views > Stacked Column Chart
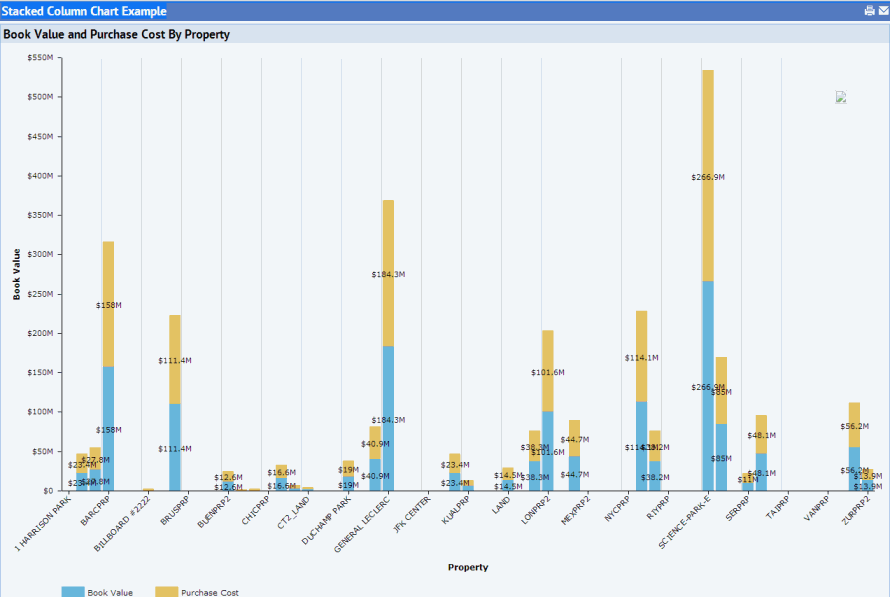
The following example demonstrates the use of two data axes in a single chart. The data is shown in a
stackedColumnChart
chart format:
view version="2.0"> <title translatable="true">Stacked Column Chart Example</title> <dataSource id="chartStackedBar_ds"> <table name="property" /> <field table="property" name="pr_id" /> <field table="property" name="value_book" /> <field table="property" name="cost_purchase" /> </dataSource> <panel id="chartStackedBar_chart" type="htmlChart" controlType="stackedColumnChart" dataSource="chartStackedBar_ds" showLegendOnLoad="true" showLegendAsPopUp="false" legendLocation="bottom" showDataTips="true" showExportButton="true" backgroundColor="0xc6e2ff"> <title translatable="true">Book Value and Purchase Cost By Property</title> <groupingAxis dataSource="chartStackedBar_ds" table="property" field="pr_id" labelRotation="45"> <title translatable="true">Property</title> </groupingAxis> <dataAxis dataSource="chartStackedBar_ds" table="property" field="value_book"> <title translatable="true">Book Value</title> </dataAxis> <dataAxis dataSource="chartStackedBar_ds" table="property" field="cost_purchase"> <title translatable="true">Purchase Cost</title> </dataAxis> </panel> </view>
The chart appears as so:

Example view: http://localhost:8080/archibus/schema/ab-products/solutions/parts/htmlchart/ab-ex-htmlchart-stackedcolumn.axvw
