Work with multiple drawings
HTML Drawing Control
Work with multiple drawings
This topic has these sections:
- Display Multiple Drawings
- Asynchronous Mouse Zoom/Pan/Zoom Window
- Synchronous Toolbar Zoom
- Select Assets in Multiple Drawings
- Select Layers in Multiple Drawings
- Select Highlight / Label / Border Data Source for Multiple Drawings
- Display Information Window for Multiple Drawings
Note : Redlining and drawing names are not available for multiple drawings.
Display Multiple Drawings
The drawing control can display single or multiple drawings. Add-in managers can use the drawing control API to load and unload drawings into the control.
There are two layouts supported and you can set the parameter ''orderByColumn' to control the layout:
- Vertical Layout: The control orders drawings in vertical columns, each column displays all the floors for one building,
- Horizontal Layout: The control orders drawings in horizontal rows, each row displays all the floors for one building.
When the user loads a new drawing, the control displays it in the corresponding column or row, below or next to other drawings from the same building. When the user unloads a drawing, if the drawing is not in the last column/row, the rest of the drawings of the same column/row will shift; if the drawing is the last one in the column/row, the whole row and column will be removed.
The control displays a thin white space gap between drawings.

To enable multiple drawing and order by column/row,
var parameters = new Ab.view.ConfigObject(); parameters['allowMultipleDrawings'] = 'true'; parameters['orderByColumn'] = 'true';
Example view : http://localhost:8080/archibus/schema/ab-products/solutions/programming/drawing/ab-ex-dwg-html-control-multipledrawing-layout.axvw
Asynchronous Mouse Zoom/Pan/Zoom Window
Users can zoom and pan each drawing separately. To zoom or pan any drawing, the user moves the mouse over that drawing, and uses the scroll wheel to zoom, or drags to pan.
Users can also use the Zoom Window operation to zoom to a specific area within one drawing. With multiple drawings, users can use the zoom window operation for one drawing at a time, not for multiple drawings.

Example view : http://localhost:8080/archibus/schema/ab-products/solutions/programming/drawing/ab-ex-dwg-html-control-multipledrawing-layout.axvw
Synchronous Toolbar Zoom
Users can use the Zoom In/Out buttons in the drawing toolbar to zoom all drawings synchronously.
They can use the Show Extent toolbar button to re-display all drawings at their original extent.

To enable Synchronized Zoom, add the Navigation Toolbar add-on:
parameters['addOnsConfig'] = { 'NavigationToolbar': {divId: "svgDiv"}, ... };
Example view : http://localhost:8080/archibus/schema/ab-products/solutions/programming/drawing/ab-ex-dwg-html-control-multipledrawing-layout.axvw
Select Assets in Multiple Drawings
Users can click on rooms or assets in any drawing to select them. The control keeps track of selected assets. Add-in managers can add application level codes to display information for selected assets, and add actions that operate on these selected assets. These operations typically act on all assets selected in all drawings.
Users can also use the Select Window operation to select a set of assets within one drawing. They can use this operation continuously to select assets from different drawings.

Example view : http://localhost:8080/archibus/schema/ab-products/solutions/programming/drawing/ab-ex-dwg-html-control-multiple-select.axvw
Select Layers for Multiple Drawings
Add-in managers can set the option to display the Layers panel over the drawing control. Users can click on layer names to show or hide assets from that layer. This affects all drawings.
When the control displays one drawing, the Layers panel shows the list of all layers in the published SVG file for that drawing. Users can also pass pre-defined layers name to show a subset of the published layers on the Layers panel.
When the control displays multiple drawings, the Layers panel shows the list of only those layers that exist in all drawings ("common" layers). When user unloads a drawing, the "common" layers will be re-adjusted to reflect common layers for the remaining drawings.
Add-in managers can define custom event when user check or uncheck the entries of Layers panel.
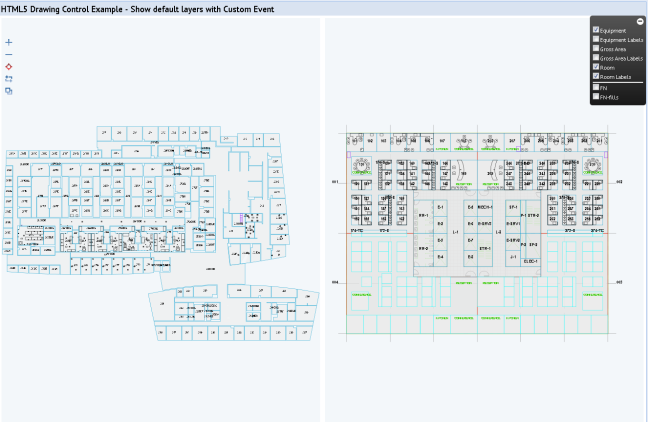
To enable Layers panel (layers popup):
parameters['addOnsConfig'] = { ... 'LayersPopup': {divId: "svgDiv", layers: "rm$;rm$TXT;eq-assets;eq-labels;jk-assets;jk-labels;background", defaultLayers: "rm$;rm$TXT;eq-assets;jk-assets", customEvent: onCheckBoxChanged} ... };
Example view : http://localhost:8080/archibus/schema/ab-products/solutions/programming/drawing/ab-ex-dwg-html-control-showlayers-customevents.axvw
Select Highlight / Label / Border Data Source for Multiple Drawings
The drawing control can display highlights, border highlights, and labels based on application-specific data source. Add-in managers defines data sources in view files, and display datasource selectors for these data sources in the drawing panel header. Selected highlights and labels apply to all drawings.
When the user selects a different highlight or label data source using a datasource selector, the drawing control re-loads the drawing (or multiple drawings) with specified highlight or label data.
If the drawings have asynchronous pan/zoom state, reloading will retain the current zooming and panning state of these drawings.

You need to define Highlight and Label datasource to show on the list:
Define Highlight and Label Datasources
<!-- Vacant Rooms --> <dataSource id="highlightVacantRoomsDs" type="DrawingControlHighlight"> <title>Vacant Rooms</title> <table name="rm" role="main"/> <field table="rm" name = "bl_id"/> <field table="rm" name = "fl_id"/> <field table="rm" name = "rm_id"/> <field table="rm" name = "count_em" legendKey="true"/> <parameter name="occupancy" dataType="verbatim" value="1=1"/> <restriction type="sql" sql="${parameters['occupancy']}"/> <restriction type="parsed"> <clause relop="AND" op="=" value="0" name="count_em" table="rm"/> </restriction> </dataSource> <dataSource id="labelDetailsDs" type="DrawingControlLabels"> <title>Details</title> <table name="rm" role="main"/> <field name="bl_id" hidden="true"/> <field name="fl_id" hidden="true"/> <field name="rm_id"/> <field name="rm_type"/> <field name="area"/> <parameter name="occupancy" dataType="verbatim" value="1=1"/> <restriction type="sql" sql="${parameters['occupancy']}"/> </dataSource>
To enable Highlight/Label Selector:
Enable Highlight and Label Selector
parameters['highlightParameters'] = [{'view_file':"ab-ex-dwg-html-control-datasources.axvw", 'hs_ds': "highlightNoneDs", 'label_ds':'labelNoneDs'}]; parameters['addOnsConfig'] = { ... 'DatasourceSelector': {panelId: "svg_ctrls"}, };
Display Information Window for Multiple Drawings
The drawing control displays one info window for all drawings. The info window displays information about selected asset(s) by default.
Add-in managers can display custom information in the info window using InfoWindow add-on's API in javascript.

To enable information window:
Enable Info Window
parameters['addOnsConfig'] = { ... 'InfoWindow': {width: '400px', position: 'bottom', customEvent: this.onCloseInfoWindow } };
Example view : http://localhost:8080/archibus/schema/ab-products/solutions/programming/drawing/ab-ex-dwg-html-control-eq-events.axvw