Net Capital Cash Flow by Location Chart
Real Property / Portfolio
Net Capital Cash Flow by Location Chart
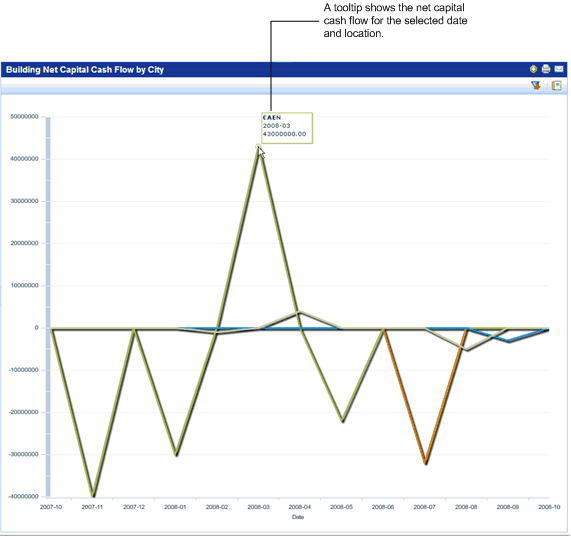
The Net Capital Cash Flow by Location and the Portfolio Summary Net Capital Cash Flow by Location charts enable you to examine your capital investments against income from selling portfolio items on a timeline grouped by geographic location. Real estate transactions are calculated as the sum of purchasing costs minus the sum of selling costs for all real estate transactions for the month.
Note : If you are using the Archibus Enhanced Global Feature Set , the Net Capital Cash Flow is shown using your User Default Currency . Net Capital Case Flow is calculated as the Purchase Cost - Selling Cost, and does not include the VAT amount, as this chart is used for internal analysis for which VAT is not relevant.
Accessing the Chart
You can generate the Portfolio Summary Net Capital Cash Flow by Location chart for all your portfolio items from Real Property / Portfolio / Portfolio Summary / Portfolio Summary Net Capital Cash Flow by Location .
You can generate the Net Capital Cash Flow by Location chart for just buildings, structures, or land using these tasks:
- Real Property / Portfolio / Buildings / Building Cash Flow
- Real Property / Portfolio / Structures / Structure Cash Flow
- Real Property / Portfolio / Land / Land Cash Flow
The chart is also available from the dashboard views:
- Real Property / Portfolio / Portfolio Summary / Portfolio Summary Dashboard
- Real Property / Portfolio / Buildings / Building Dashboard
- Real Property / Portfolio / Structures / Structure Dashboard
- Real Property / Portfolio / Land / Land Dashboard
You can generate the chart as a report. See Generating KPI Charts as Reports.
Viewing the Chart
Click the Filter button
 in the right hand corner of the chart to display data for a different location or time frame, or to group the data by a different geographical location. You can filter the data shown in the Net Capital Cash Flow by... Chart by geographic location or time span. See
Filtering KPI Charts
. By default, data is shown for the past year, but you can select the time frame to report on. See
About Time-Based Charts
.
You can click on a bar or line in the graph to drill down to see the details for the data for that item. For example, if you click on the line for a city in a chart showing buildings grouped by city, you see a chart with data for only that city. You can drill down to view a single portfolio item (building, structure, or land). See Drilldown for KPI Charts Grouped by Geography .
Net Capital Cash Flow by... Chart When Using the Archibus Enhanced Global Feature Set
If you are using the Archibus Enhanced Global Feature Set , the Net Capital Cash Flow (calculated as Purchasing Cost minus Selling Costs) in the Cash Flow by... Charts is shown using your User Default Currency . These costs do not include the VAT amount, as this chart is used for internal analysis for which VAT is not relevant.
Business Result
The Net Capital Cash Flow chart gives a bottom-line monetary view of the capital transactions performed in a specific month. The Net Capital Cash Flow by... Chart is used to examine and analyze current expenses, and for future budgeting.
Chart Example
The following image shows the Building Net Capital Cash Flow.

