Space Gap Analysis Chart
Real Property / Portfolio / Portfolio Forecasting / Portfolio Forecast Wizard
Space Gap Analysis Chart
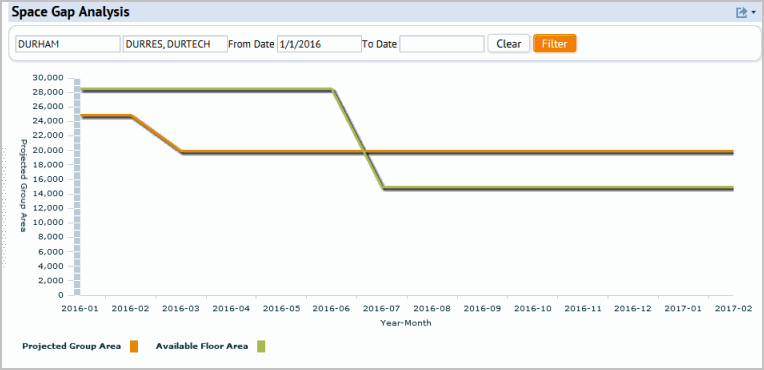
The Space Gap Analysis chart projects the space allocated to events across all buildings, and compares it against the available floor space in each time period. This chart can illustrate the periods when the projected space allocation exceeds the amount of available space (over-allocation) and the periods when the allocated group space is less than the available space (under-allocation.)
The sum of the group areas is calculated and plotted vs the sum of the total floor space. The total floor space is the total floor or suite area less any Unavailable Space records created in the Scenario. The values are calculated for the first of each month and displayed in the Space Gap chart by month.
- Using the Filter, you can select specific locations and time frames for the analysis.
Notes: Unoccupied areas are automatically included in the space gap analysis as long as at least one other floor of the building contains a group allocation in the scenario.
The below screen shot shows the Space Gap Analysis Chart when accessed from the Portfolio Forecasting Wizard.

