Debugging JavaScript
Debugging JavaScript
For cases when your custom JavaScript event handlers do not work as intended, you need an instrument that allows examining the state and behavior of the view in the browser. Specifically, your tool needs to:
- view JavaScript warning and error messages.
- examine the HTML DOM structure of the pages, including frames, forms, form input controls, and buttons.
- examine CSS layout and style properties of HTML elements.
- use breakpoints to stop execution of any JS event handler and examine the state of JS objects and variables.
We recommend Chrome for debugging JavaScript.
Chrome lets you set breakpoints in any of your own JS event handlers, as well as in any of the default Web Central JS functions.
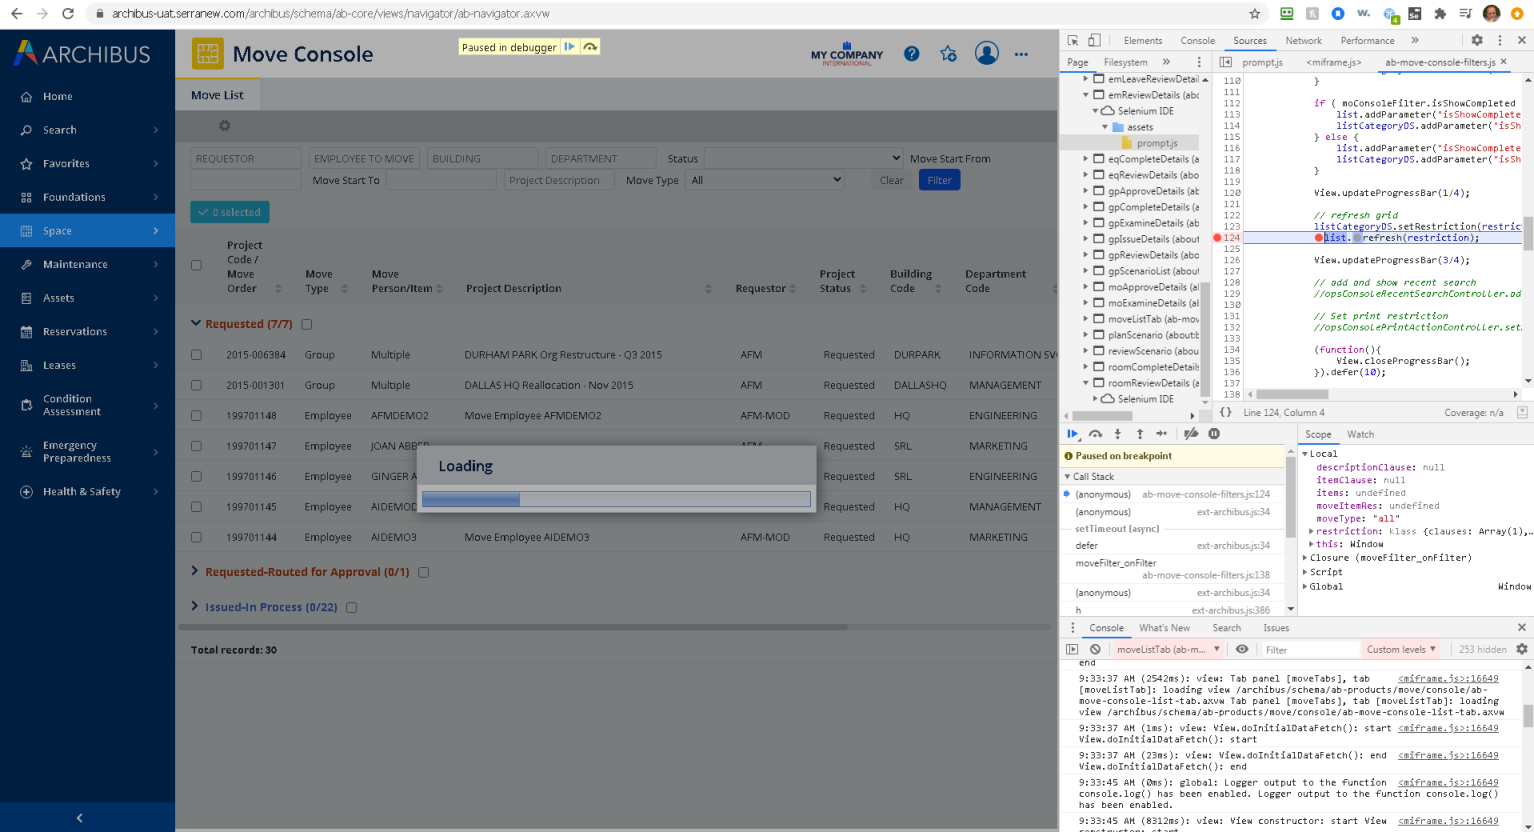
Procedure
- Select the Sources tab page in the Chrome window.
- Select the JS file name.
- Set the breakpoint in any function by clicking on the left vertical strip with line numbers.
- Click on the button or link that calls the event handler. Chrome will stop the script execution at the breakpoint and display the current local variables.