Filter the Report's Data
System / Add-In Manager / Reports Central
Foundations / Background Data & Reports / Reports Central
Filter the Report's Data
You may want to restrict the set of data that the report presents. Use the Filter option to restrict both the Chart and the Grid panels.

When users review the report, it will be set to the filters that you have set. You can choose to allow the user to change the default values of each filter, or lock the filter so that the user can see the filter properties but cannot edit it.
The values that you can filter on depend upon the fields that you have selected to display. The filter's drop-down displays all fields you have specified for the view and that are not yet displayed in the filter If the field on which you wish to filter is not visible, return to Select Fields to activate it.
Note : For reports made with Reports Central, the grid displays a maximum 500 records and the chart displays maximum of 100 values. Using a filter is a good way to streamline the data presented.
Note : For numerical filters use the X (Clear) icon to clear zero values, instead the keyboard Backspace key.
Note : When adding additional filters to an existing filter, it is advisable to click again the Filter button before saving the report in order for the filters to be re-applied. The filters are not applied automatically; they are applied only when you click on the Filter button.
Note :The filter does not convert units; it applies numeric formatting based on the database format. You should adjust the comparisons numbers accordingly by the required factor. (AD-5845)
Show and Hide the Current Filter
The Filter pane shows your current filter. You can display and hide the filter details using the Hide/Display button located in the pane. The below image shows a hidden filter. Click on the ">" button to display the filter.
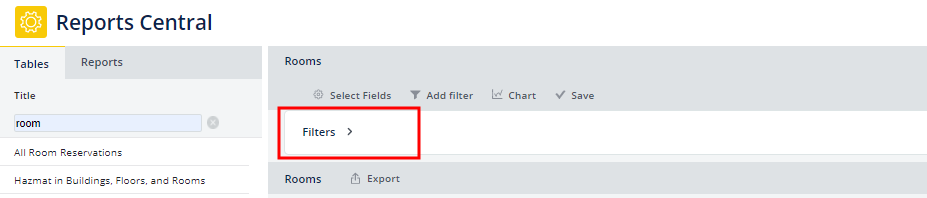
Consumers of the report may want to display the filter so that they understand the data included in the report, as shown in the Room Chargeable Area report shown in the above section.
Filter the Data
-
Make visible any fields on which you want to filter.
-
Click Add Filter at the top of the form.
-
Specify the field on which to filter: you can choose from fields active in the report and for which you have not already filtered.
-
Archibus adds a filter line to the Filter form.
-
Specify the operator and the value.
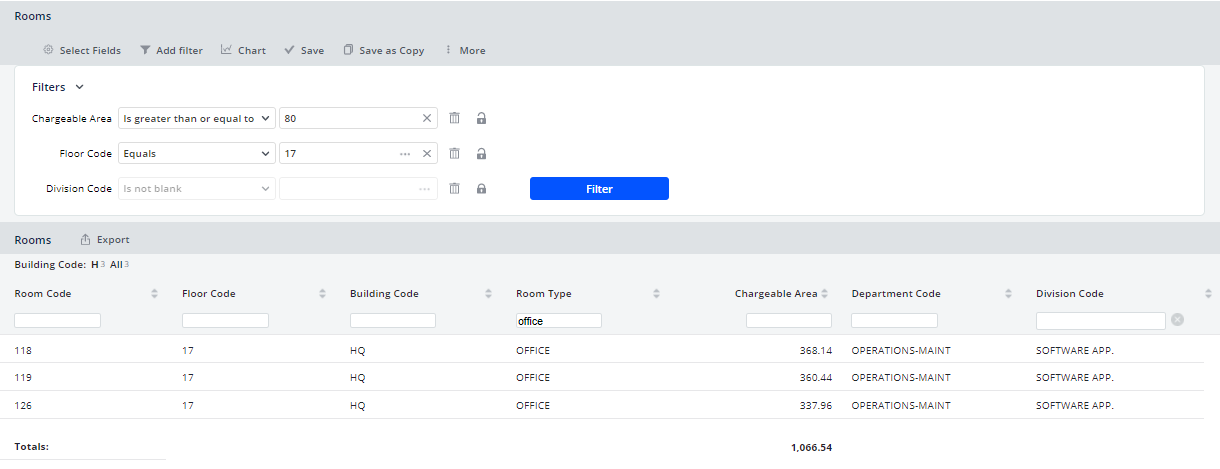
The values that you can choose for the Operator vary depending on the type of field on which you are restricting. For example, a numeric field, such as Chargeable Cost (top of topic) has different operators than text fields and validated fields, such as Division Code, below.

-
Click the Filter button. The grid redisplays to show only the records meeting the specified restriction.
-
Add additional filters by clicking Add Filter at the top of the form and specifying the field on which to filter, the operator, and the value.
Each field on which you restrict is displayed in its own line. You can lock, delete or edit a specific filter.

-
Save the report with its filter settings.
Make a Filter Permanent (Lock the Filter)
To prevent viewers of your report from changing a restriction, you can lock the restriction by clicking the Lock icon, located to the right of the Delete (trash can) icon.
The report consumer will be able to see the restriction, but not edit it. For example, in the above image the report consumer can change the Chargeable Area value or even delete this filter; however, the Floor Code and Division Field filters are locked and cannot be edited by the report consumer.
Delete a Filter
-
Use the Delete command (trash can icon, located next to the value) to delete a filter.
-
The grid redisplays to show only the records meeting the specified restriction.
Further Filter the Data in the Grid
You might have created a filter and then notice that you want to further filter the data in the grid. You can use the grid's Smart Search console to further refine the data that the grid displays and a total, if you have specified one. Note that the Smart Search filter does not affect the chart and is not saved to the view. The Smart Search filter is applied to exporting the data to Excel.