2024 August Eptura Workplace Insights Module
The Insights Module upgrade includes:
UI Menu Enhancements
When you are designing a dashboard, Settings are now anchored on the right-hand side of the screen and combine general view properties and individual dashlet settings.
After
Open the right side menu to view both the dashboard properties and this is the same for the dashlet settings.
Also, when you create a Report or Dashboard, there is a new format visualization tool available anchored to the right side of the screen along side the filters menu.
Learn more in Create a Dashboard.
Before
Click the Setting icon to display dashboard properties and double click a dashlet to display the dashlet settings

New Data Chooser
When you are designing a Dashboard, and you choose to create a crosstab, chart, or table dashlets, there is a new Data Chooser available. This will let you select multiple fields.

Then these fields can be filtered or rearranged as needed using the pre-filter and display options.
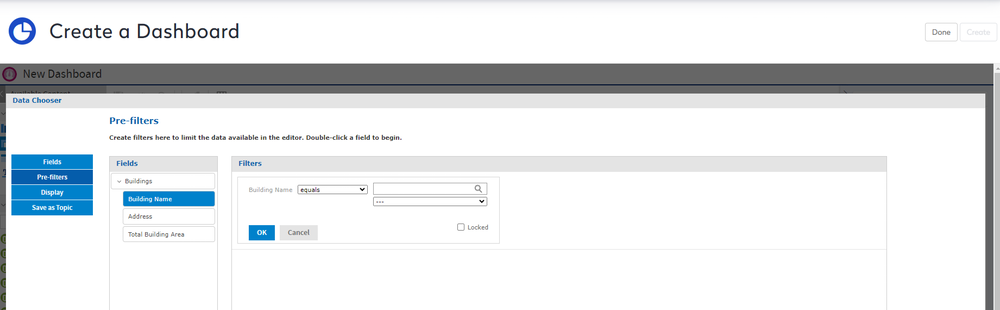
Learn more in Create a Dashboard.
Detailed Dashboard Export
Dashboards in Insights can be exported as a screenshot (with an image format of PNG, PDF, DOCX, ODT, or PPTX) or with a new detailed mode with each visualization (dashlet).

Learn more in Export a Dashboard or a Visualization (Dashlet).
Report Viewer Responsiveness
This enables the report to adapt its output to the current size of the browser window.