New Sensor Utilization Analysis for Me Spaces - 2020 December
We are releasing a new, exciting way to analyze space utilization using Sensor data within the Space Module. Space admins will be able to use this analysis tool to gain deeper insights into how their spaces are being used without complicated data queries or transformations.
Occupancy sensors can help workplaces better understand how spaces are truly being utilized with quantifiable measurements, allowing space planners to make data-driven decisions to be optimize their space strategies.
Your company will need occupancy sensors installed in your office and have sensor data hosting implemented within your iOFFICE environment in order to utilize this new analysis tool. All applicable Space Types should be assigned to a Space Group - "me" or "we" spaces. Re-familiarize yourself with our space hierarchy and structure here: Space Groups, Target Seating and Meeting Ratios.
Read on to learn more about these new analytics available in the Space Module.
Using the Sensor Utilization Analysis
The new analysis tool from the Space Desktop is simple to use, yet customizable enough for you to get the insights you need.
To analyze sensor data, navigate to the Space Desktop. Switch to Sensor mode using the top left icon, click the Information tab, then click Utilization Analysis. A report wizard will appear and prompt you to set parameters for the data.
Building the analysis
Step 1: Select the types of space you want to analyze. For this release, only “Me Spaces” are available for analysis, which includes spaces with a single capacity such as offices or desks. In the future, we will expand the analytic capability to cover We Spaces as well. Select Assigned spaces, Unassigned spaces, or compare the two.
Step 2A: You can drill down to view analytics for a specific floor, or drill up and view entire buildings. The dynamic search field lets you simply type a floor or building name and quick select it. You can add additional filters with the + button and view specific space Types or Categories.
Step 2B: Group the data by Building, Floor, Space Type, or Space Category.
You can tailor the analysis to your unique strategy in the Advanced Options menu. Change how "Peak Hours" are calculated or set custom utilization thresholds that determine if a space is "Well Utilized" or "Poorly Utilized." Every workplace is different, and these advanced options help you better define and track utilization metrics specific to your spaces.
Step 3: Select the date range for which you want to analyze sensor data.
Click Analyze Data to start the analysis. Calculations and processing may take some time depending on the scope of the data. The analysis will display in a new Report tab on the Space Desktop.
Reading the analysis
Once the analysis is generated, you are able to drill deeper into the data with dynamic calculations and recommendations.
Click the Definitions button to review the report's terminology and learn how measurements are calculated.
- Measured Utilization - The exact time measured by a sensor. The sensor is considered “active” or “inactive” as soon as the sensor reports its state.
- Effective Utilization - Time biased towards a sensor remaining active. When a sensor becomes inactive, it is not recorded as inactive until it remains inactive for X minutes (configurable by customer in Advanced Options). This is to create “effective” activity, which accounts for the space’s user stepping away for short breaks and similar behavior.
- Peak Utilization - The measured utilization, filtered to the window of time in a day when the utilization is the highest. The window is X consecutive hours (configurable by customer in Advanced Options).
- Measured Active Percentage - A good indicator of how well a space is used, the measured active percentage is the measured time a space is active in a day, averaged across every day in the selected date range. This metric only considers time measured by the sensors.
- Effective Active Percentage - A better indicator of how well a space is used, effective active percentage is the effective time a space is active in a day, averaged across every day in the selected date range. This metric does not count a space inactive unless the sensor is idle for more than 30 minutes, to help account or regular breaks and similar behavior.
- Space Engagement - The best indicator of how well a space is used. Ideally, spaces should be used at regular intervals over the course of a full work day. The space engagement is the measured time a space is active, averaged across only the days in the selected date range where the space had effective activity in at least 5 distinct hours. This metric shows both how long a space was used in a full workday, as well as how often it was used for a full workday.
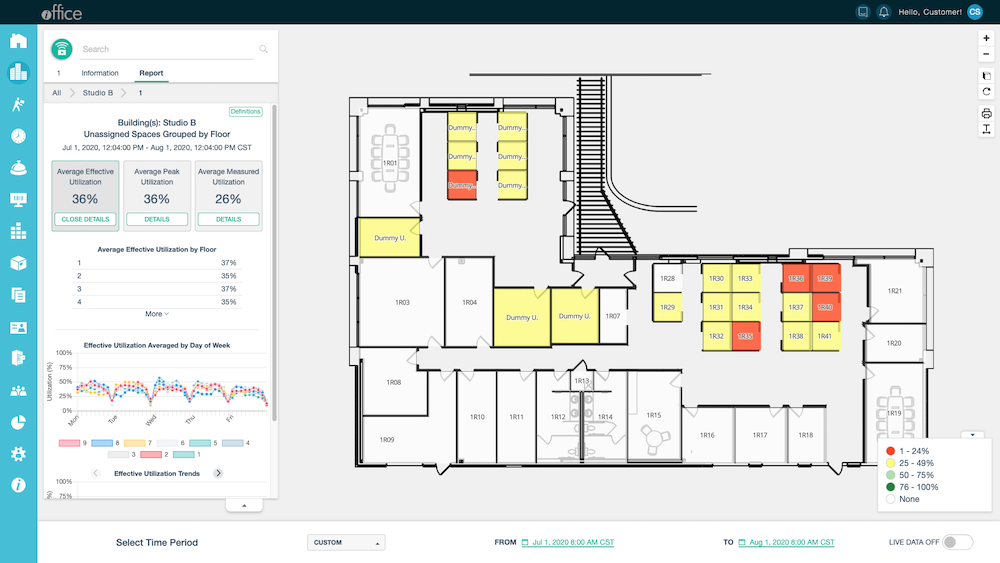
The first section gives a quick summary of Average Effective, Peak, and Measured Utilization of the selected spaces. Click Details under each average to see the data graphed by day of the week or as a trend line. These visualizations provide valuable business intelligence in an easy-to-understand format without requiring the admin or space planner to use complicated queries or data science tools.
The "Recommendations" section shows lists that help you quickly see Engagement data for each space and determine which are Well Utilized or Poorly Utilized. The lists are dynamic based on the thresholds you set earlier, so you can quickly drill down into the data and take action on specific spaces to optimize your utilization strategy.
Advanced sensor utilization analytics enable space planners to gain deeper insights into how their space is being used, enabling them to make data-driven decisions to optimize their strategies. This new analysis tool makes it easier to view and use the sensor data without using complex data quereies or other data science tools. If you are interested in finding out more about how to activate this feature contact your Account Manager. If you have any questions, please call 713-526-1029 or send an email to support@iofficecorp.com.