New Features for Custom Reports and Dashboards
Multiple features have been added to the Reports module to provide you with additional customization options and an improved user experience. In addition, powerful tools that were previously available only for reports, such as schedule and export options, are now available for dashboards. This upgrade provides you with an increasingly robust and customizable product, allowing you to access and interact with your data more effectively.
Important - You must clear your browser cache and cookies for this upgrade to take effect. You will not be able to access your reports or dashboards until you complete this step.
With this upgrade, you can now perform the following actions in the Reports module:
- Interact with your data using new chart types. New chart types are available for your reports and dashboards, including tree charts for hierarchical data and semi-pie charts, allowing you to visualize and interact with your data in additional formats.
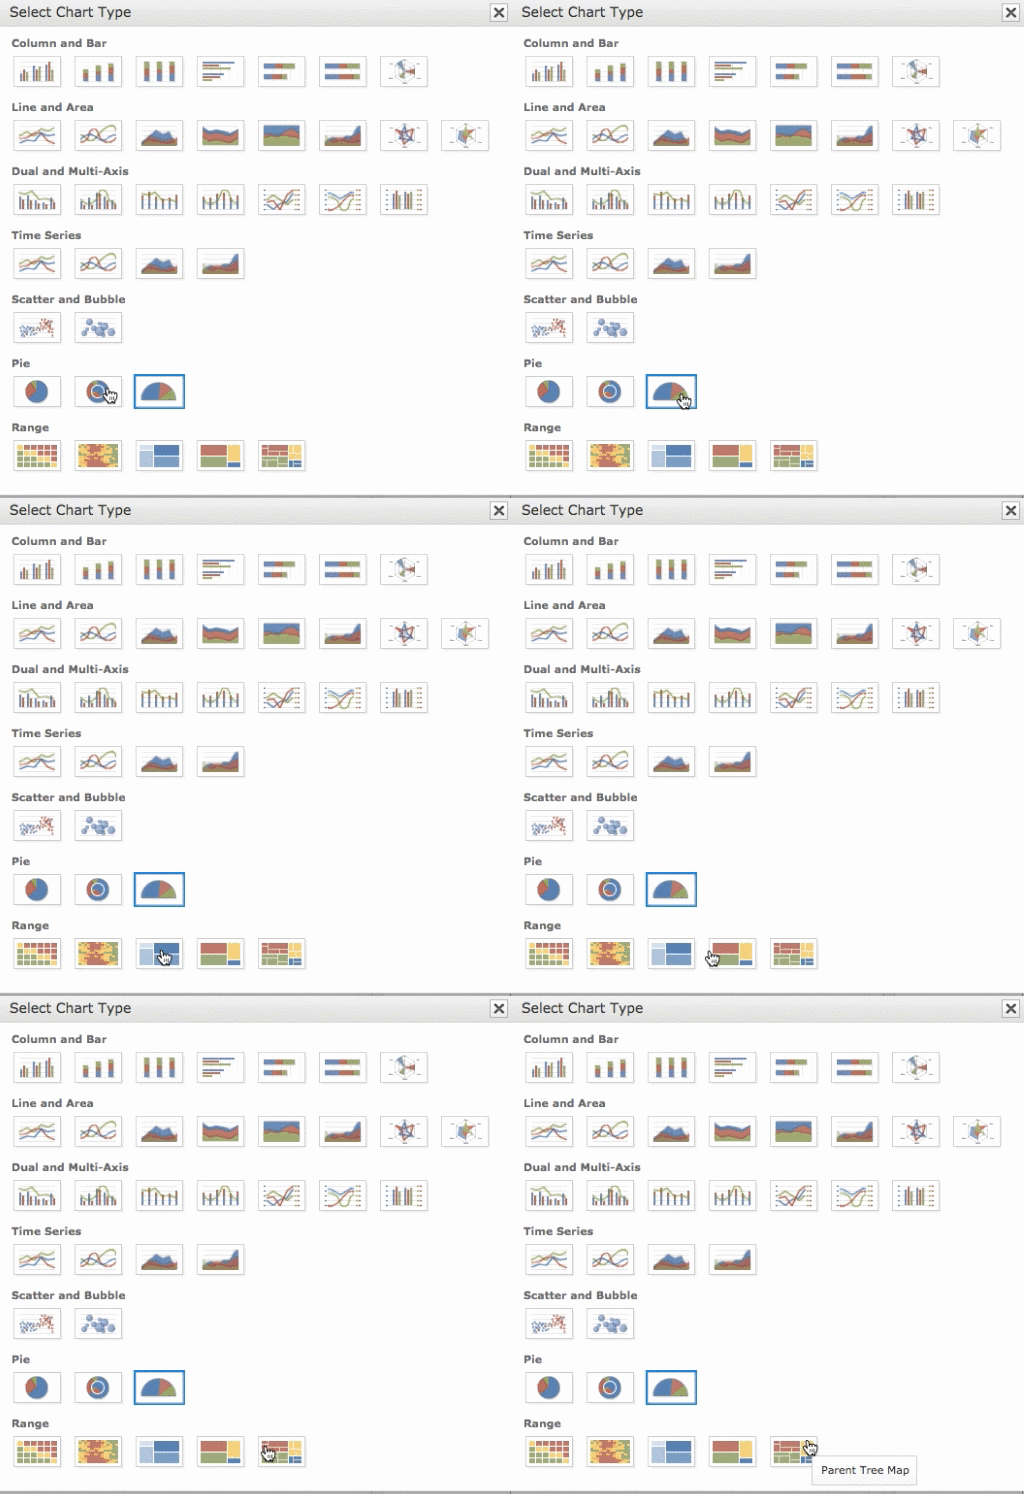
For example, you can use the new Tree Map chart type to create a visual representation of your available space.
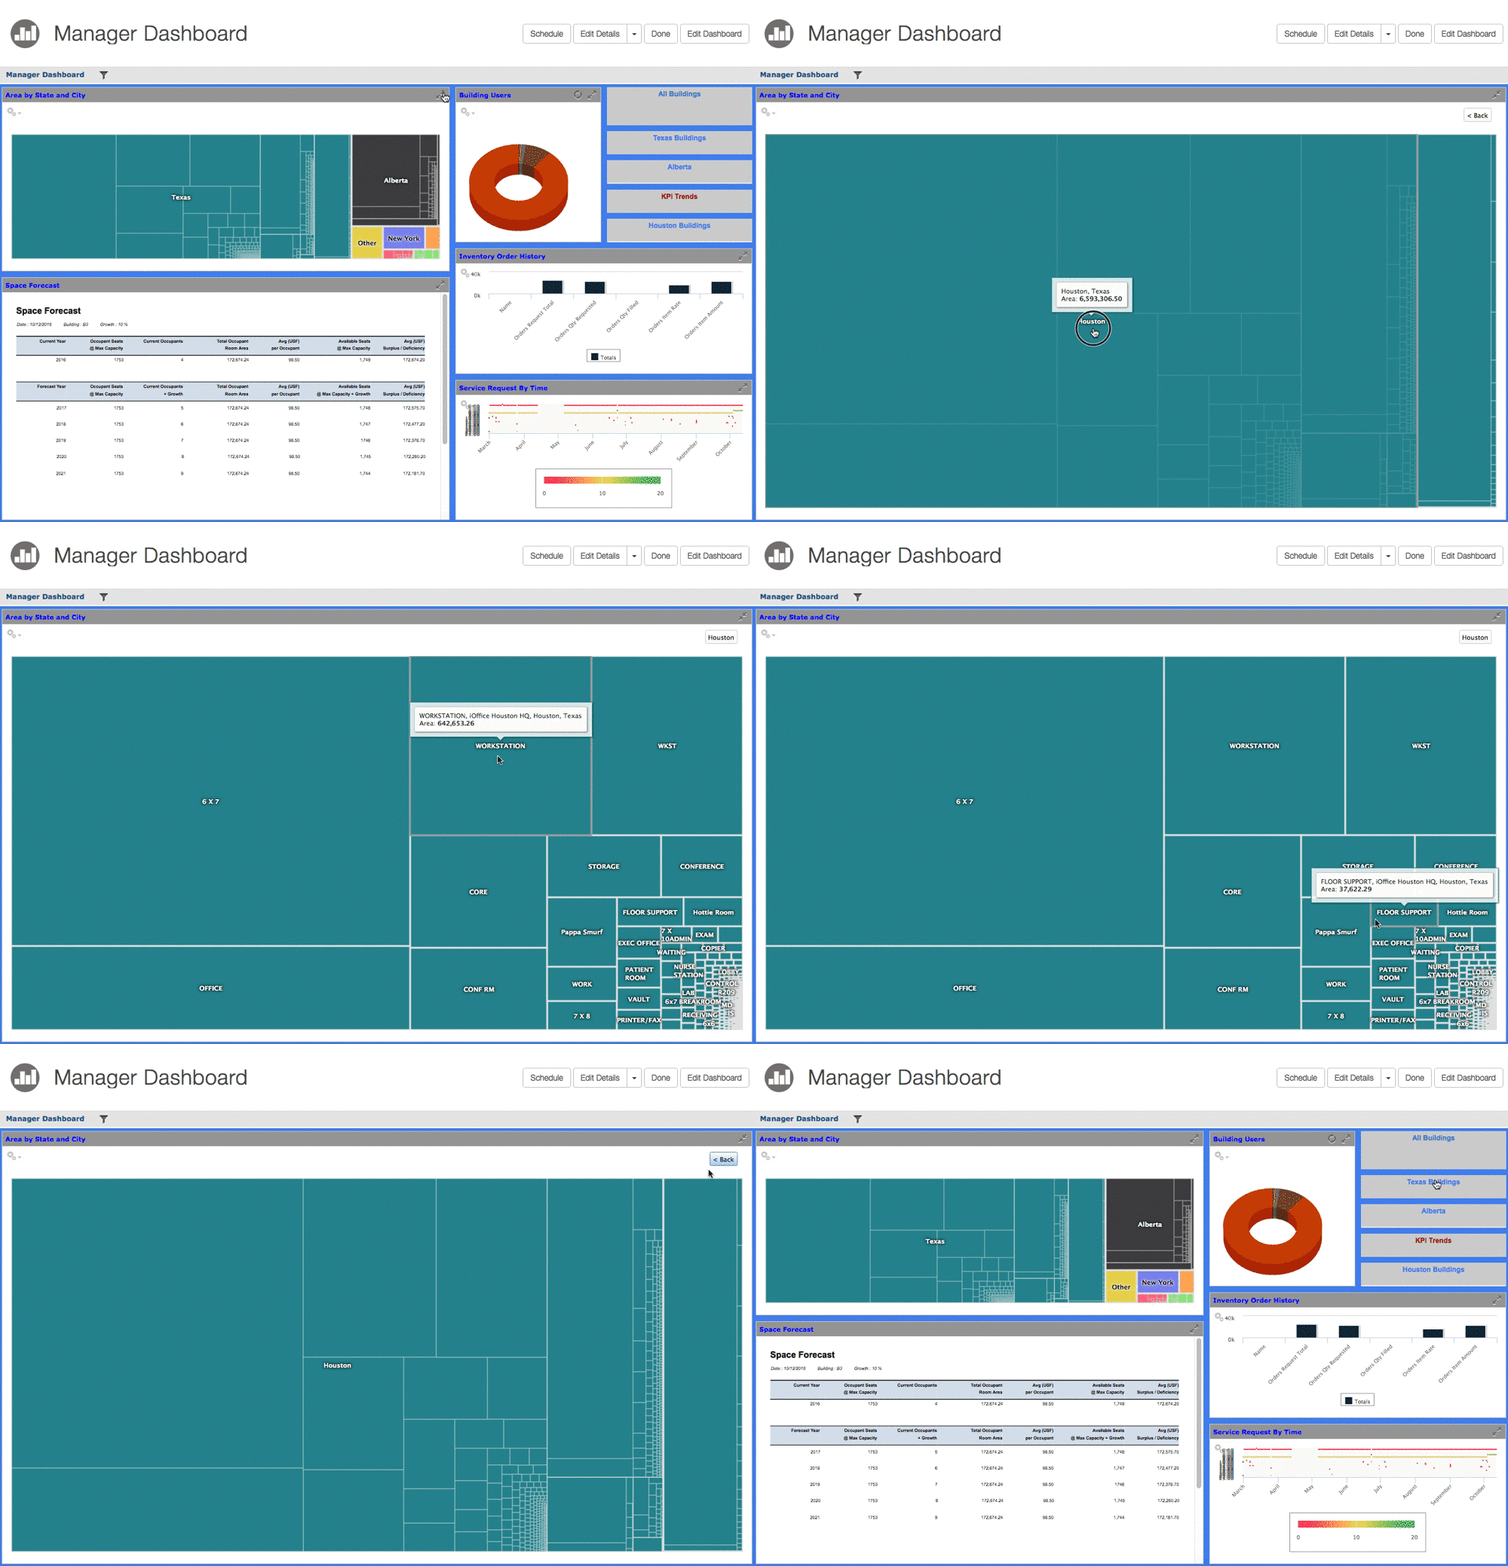
These new charts provide you with additional options for interacting with your data, allowing you to visualize your data in an advanced, user-friendly format.
- Access additional dashboards using image and text hyperlinks. Dashboards now support image and text hyperlinking, allowing you to quickly link to and access your other reports or dashboards. For example, you can create a dashboard link to a report displaying occupant capacity by building.
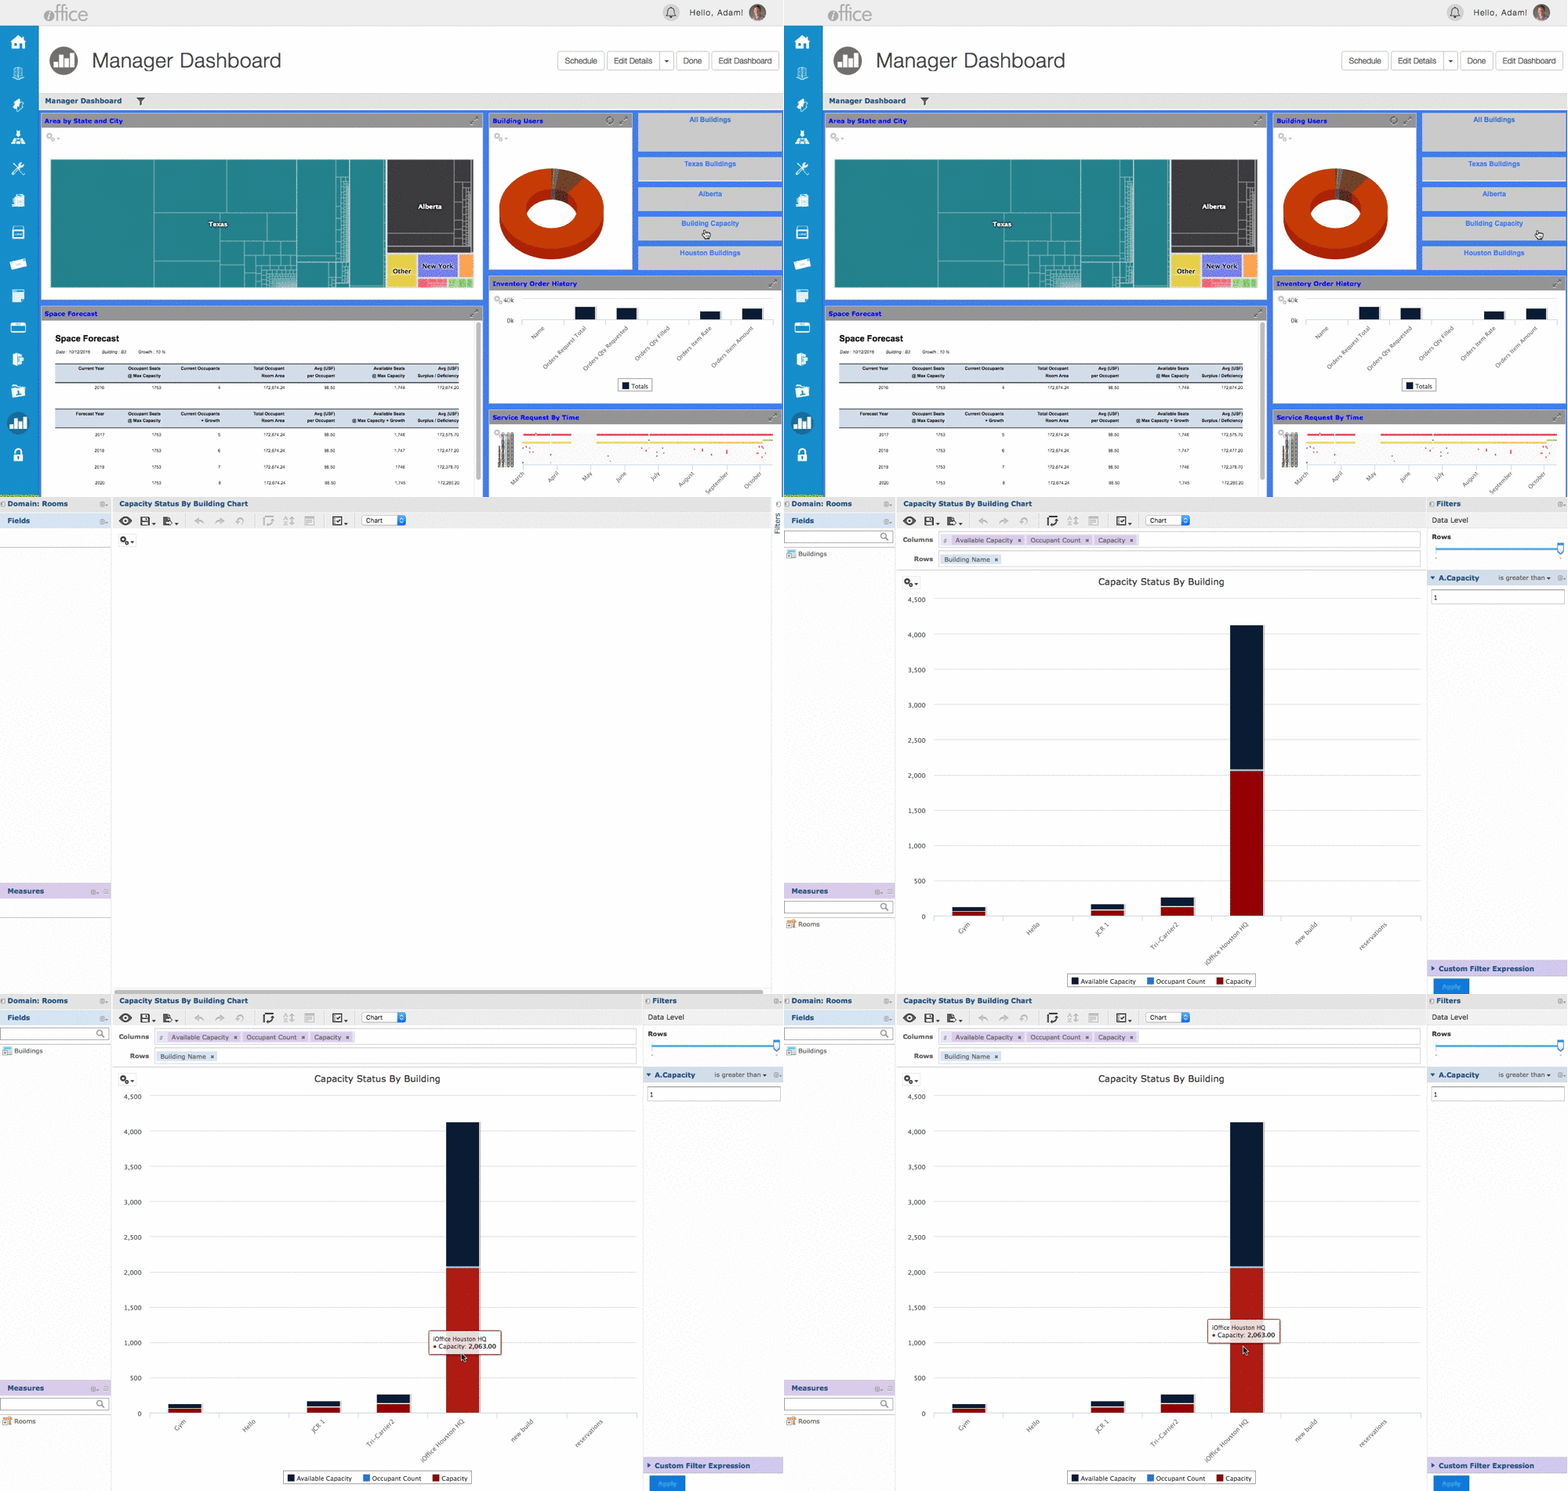
Using this new feature, you can create links to all of your important reports and dashboards in a single location, increasing the ease of navigation in the Reports module.
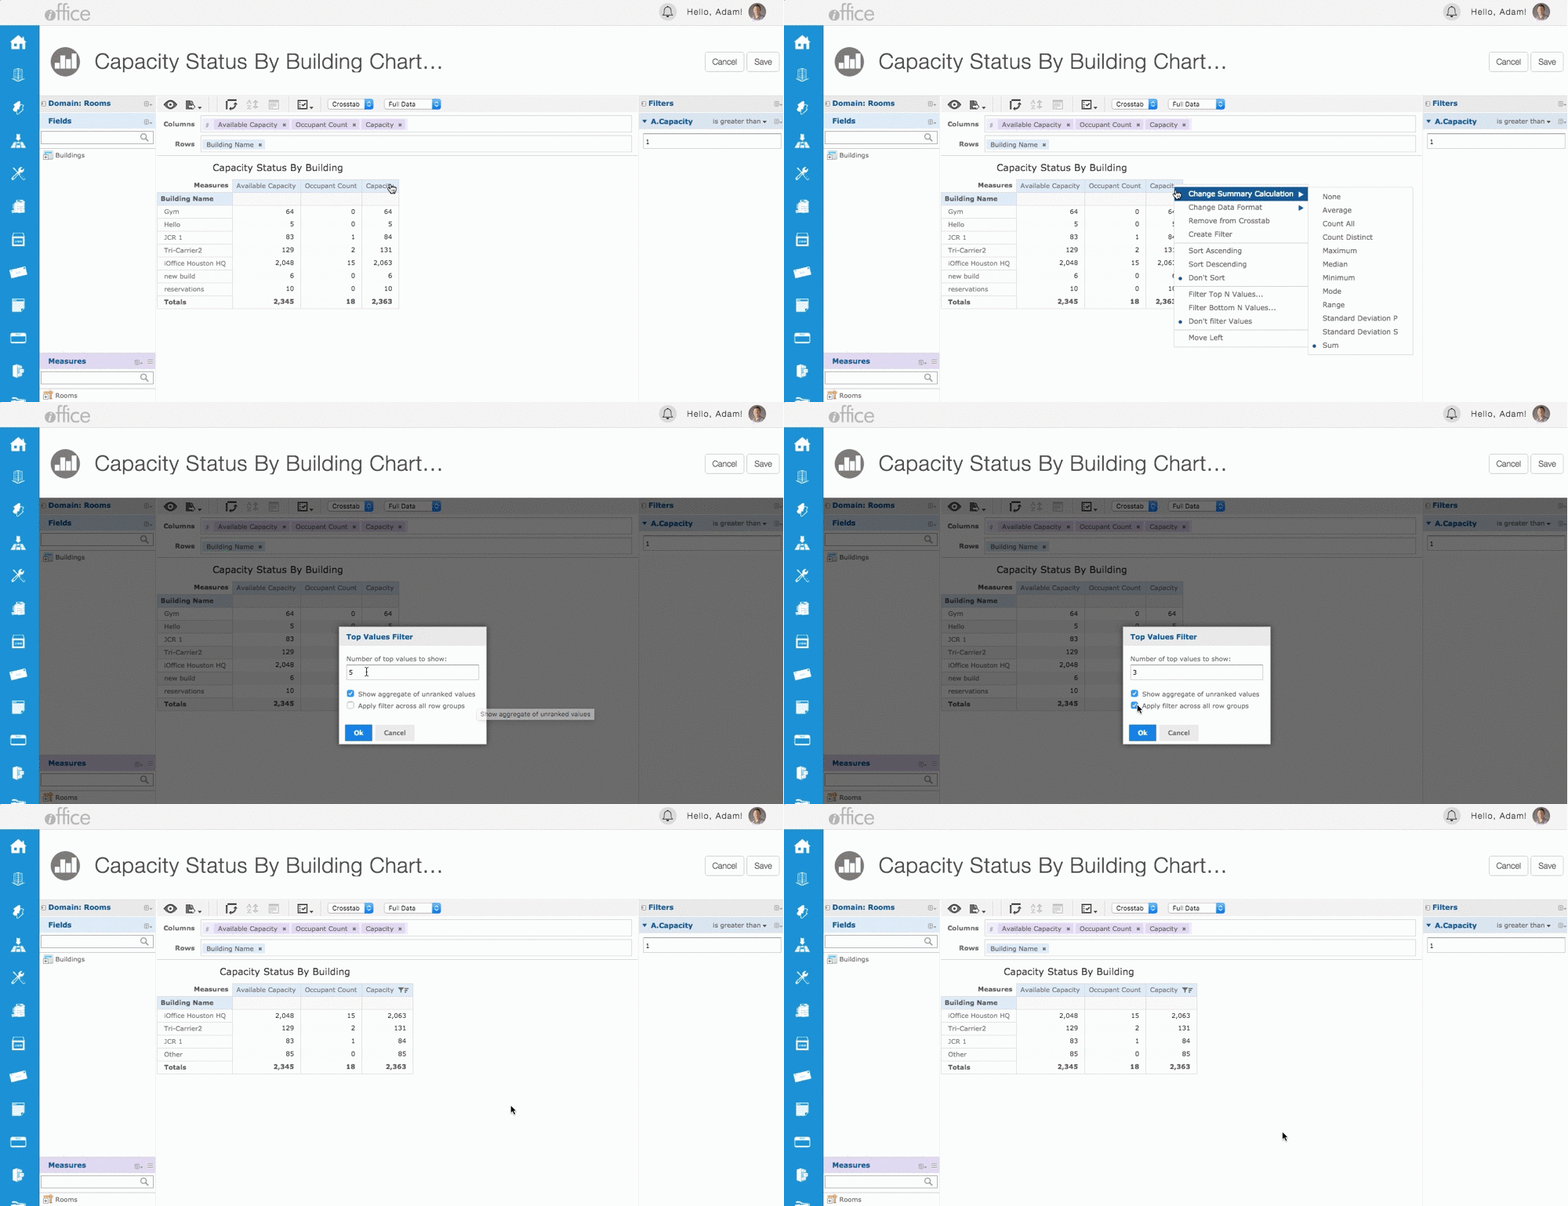
- Create specific dashlets using new filtering options. You can filter the numeric data shown in a crosstab to show only the rows with the top or bottom 'N' values, where N is a number that you specify. For example, you can now filter a crosstab to display only the top 3 values in a column.
- Schedule dashboards to simplify your processes. Dashboards can now be scheduled, allowing you to select a time for the dashboard to update and send the dashboard to specified recipients by email.
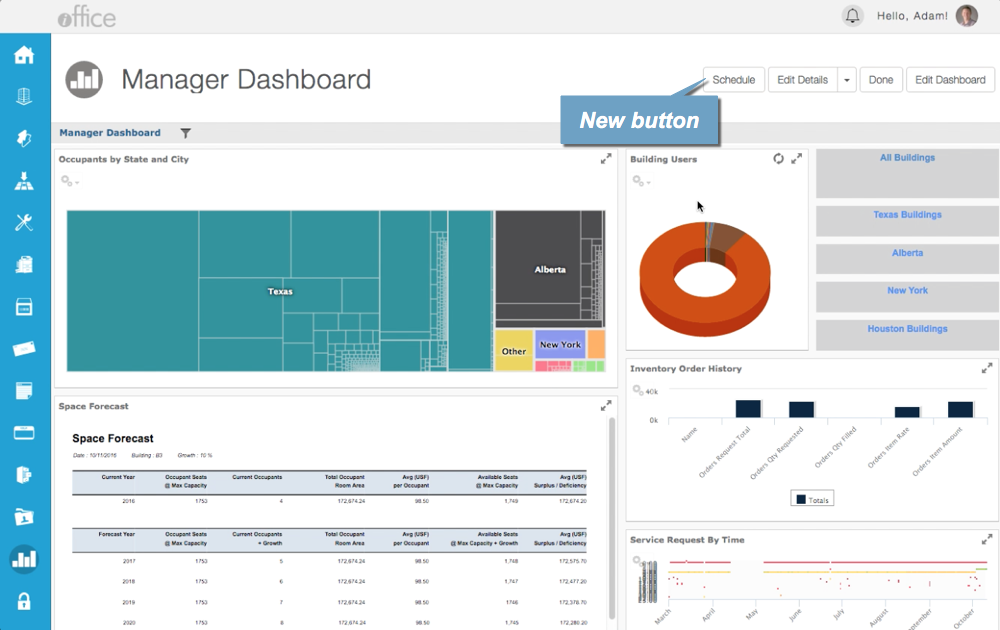
- Export dashboards for easy information sharing. You can now export dashboards in various formats similar to reports. To use the Export feature on a custom dashboard, first display your dashboard and click the Edit Dashboard button. The Edit Dashboard screen displays.
Note: This feature is only available for custom dashboards at this time. The Export feature will be available for standard dashboards in the coming weeks.
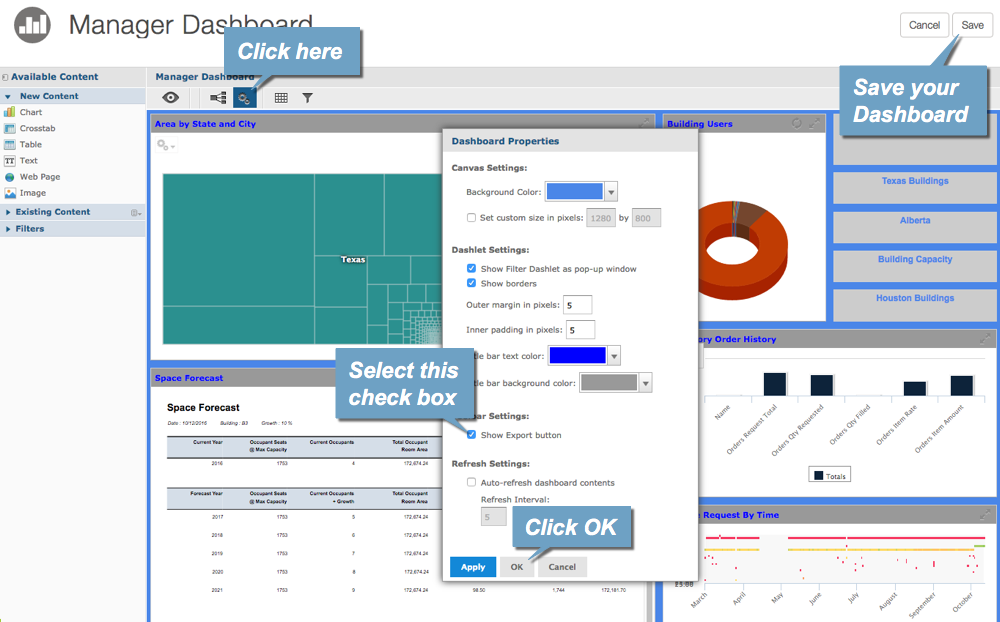
On this screen, click the (Configure) button to access the Dashboard Properties window, select the Show Export Option check box, and click the OK button. Then click the Save button on the Edit Dashboard screen to save your settings. The Export option is enabled for your dashboard and the
  (Export) button displays on the dashboard.
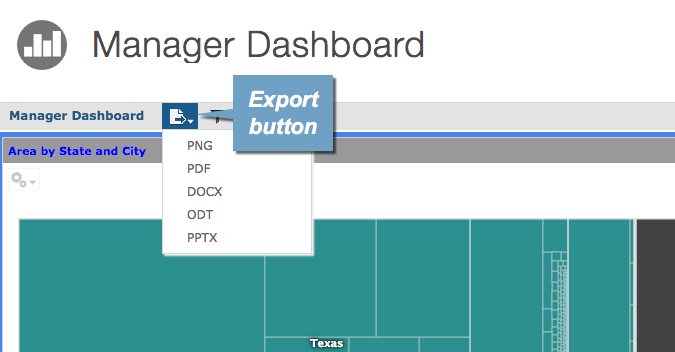
This feature allows you to export your dashboard in the format of your choosing, allowing you to create a shareable document in a couple clicks.
- Promote your brand using new dashboard styling options. Various new styling options are now available for dashboards, allowing you to change the background color and the color of the text within each dashlet.
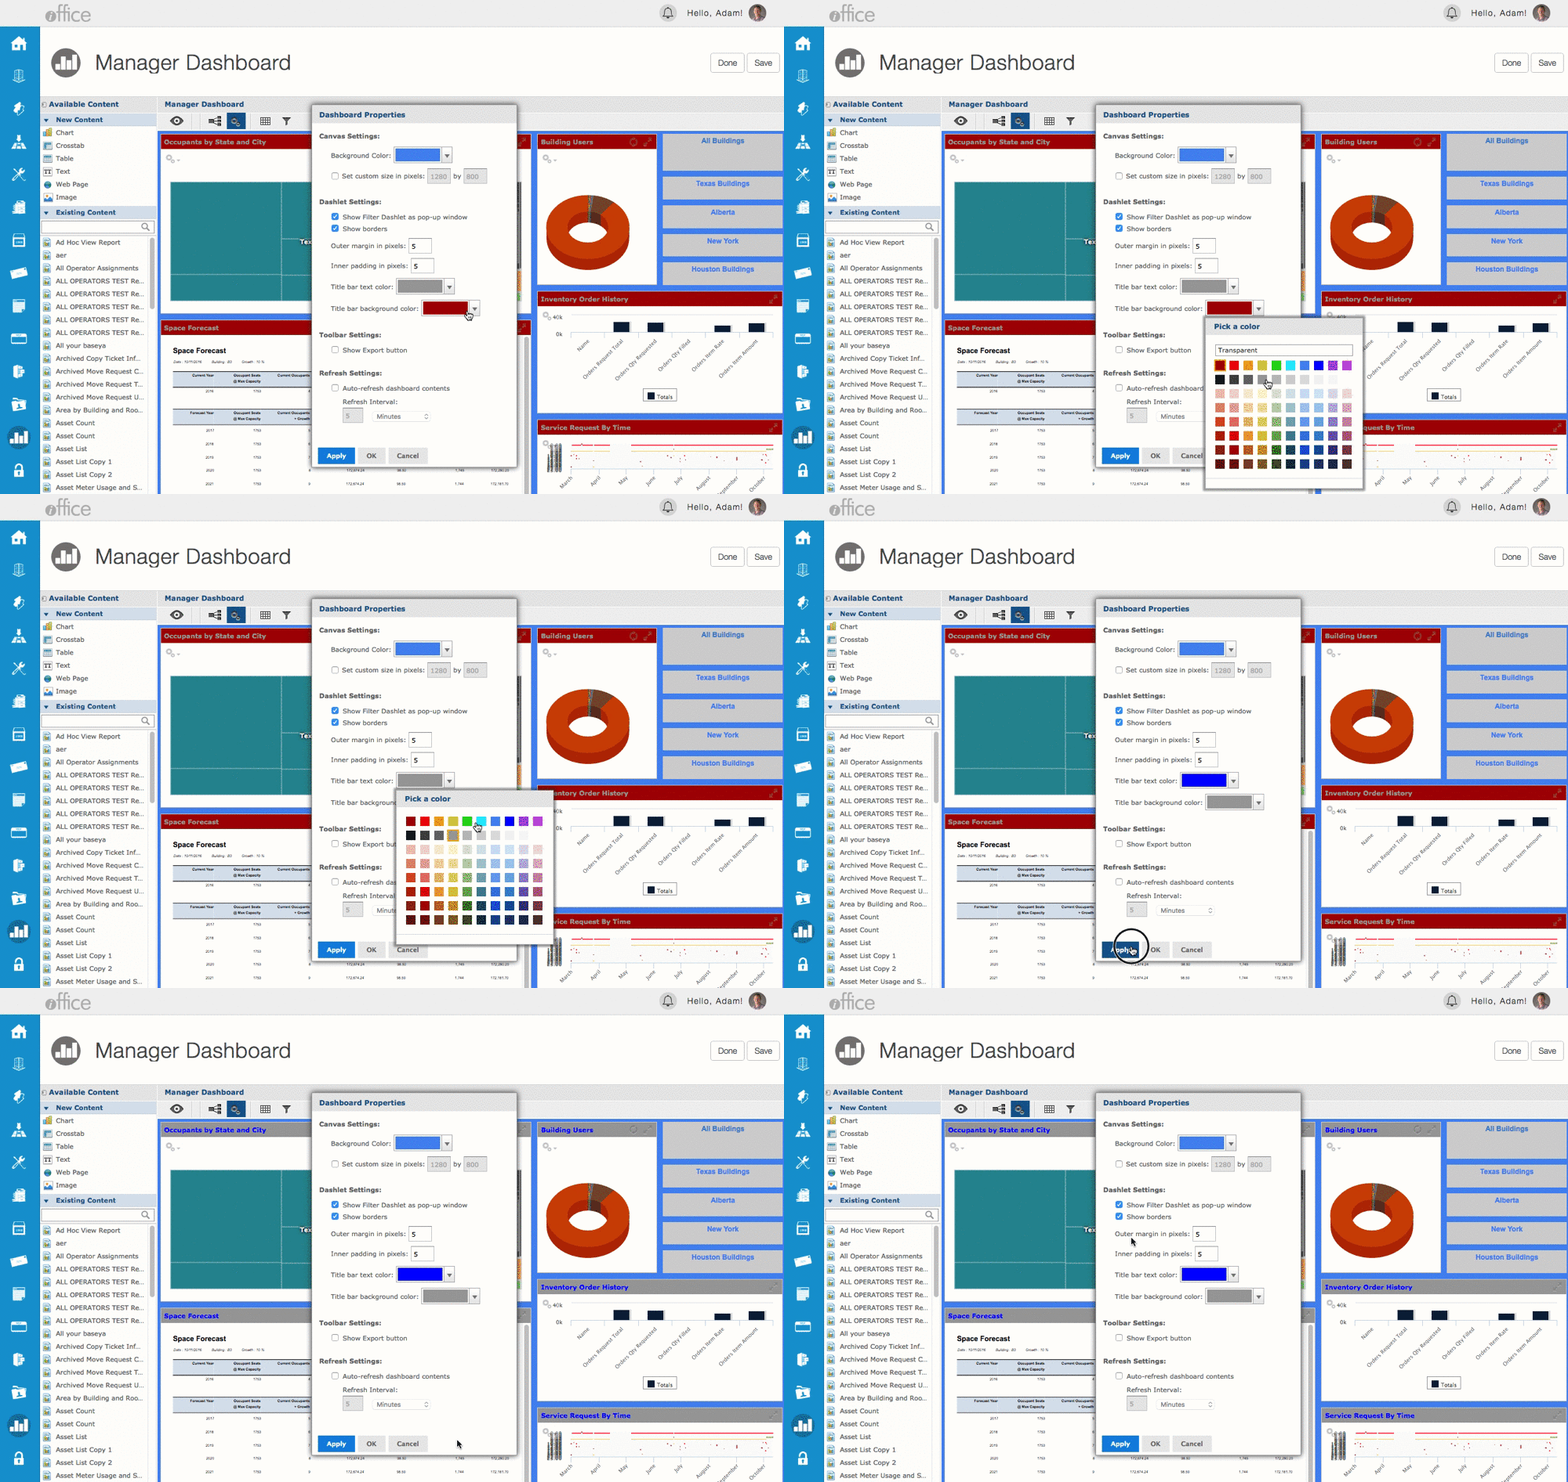
Using these new options, you can further customize your dashboards to match your company's brand.
These powerful new features increase the versatility of the dashboards and reports available in the iOffice application, allowing you to view, share, and interact with your data in an increasingly customizable, user-focused environment. If you have any questions, please call 713-526-1029, or send an email to support@iofficecorp.com.
