Space Forecasting and Planning Enchancement - 2020 March
Space forecasting and plans for move planners can be difficult to visualize. The newly added Space Forecasting in the stacking diagram makes this task easy. With the space forecasting and planning feature, you can plan for growth or reduction by your defined categories and depths. To access the space forecasting click on the Move module, and then click on Stacking Diagram.
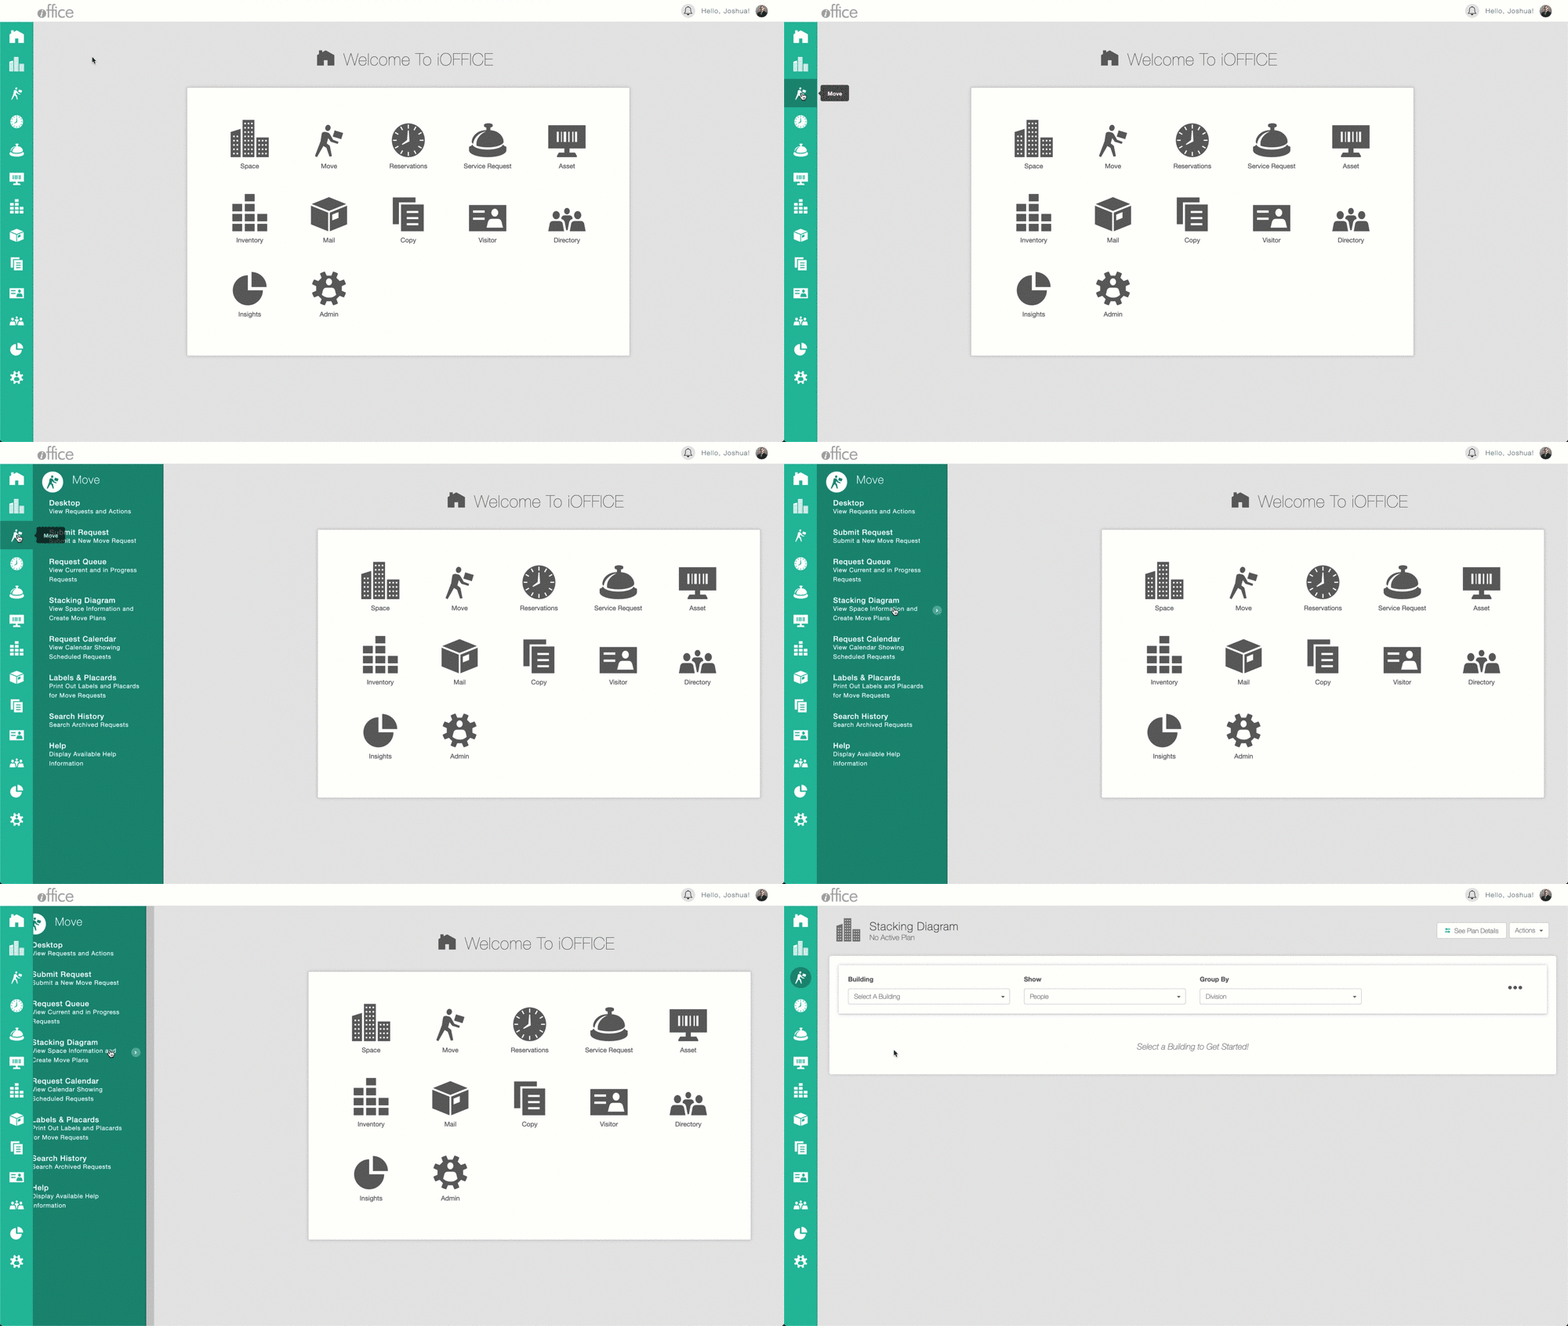
Getting Started in Space Forecasting
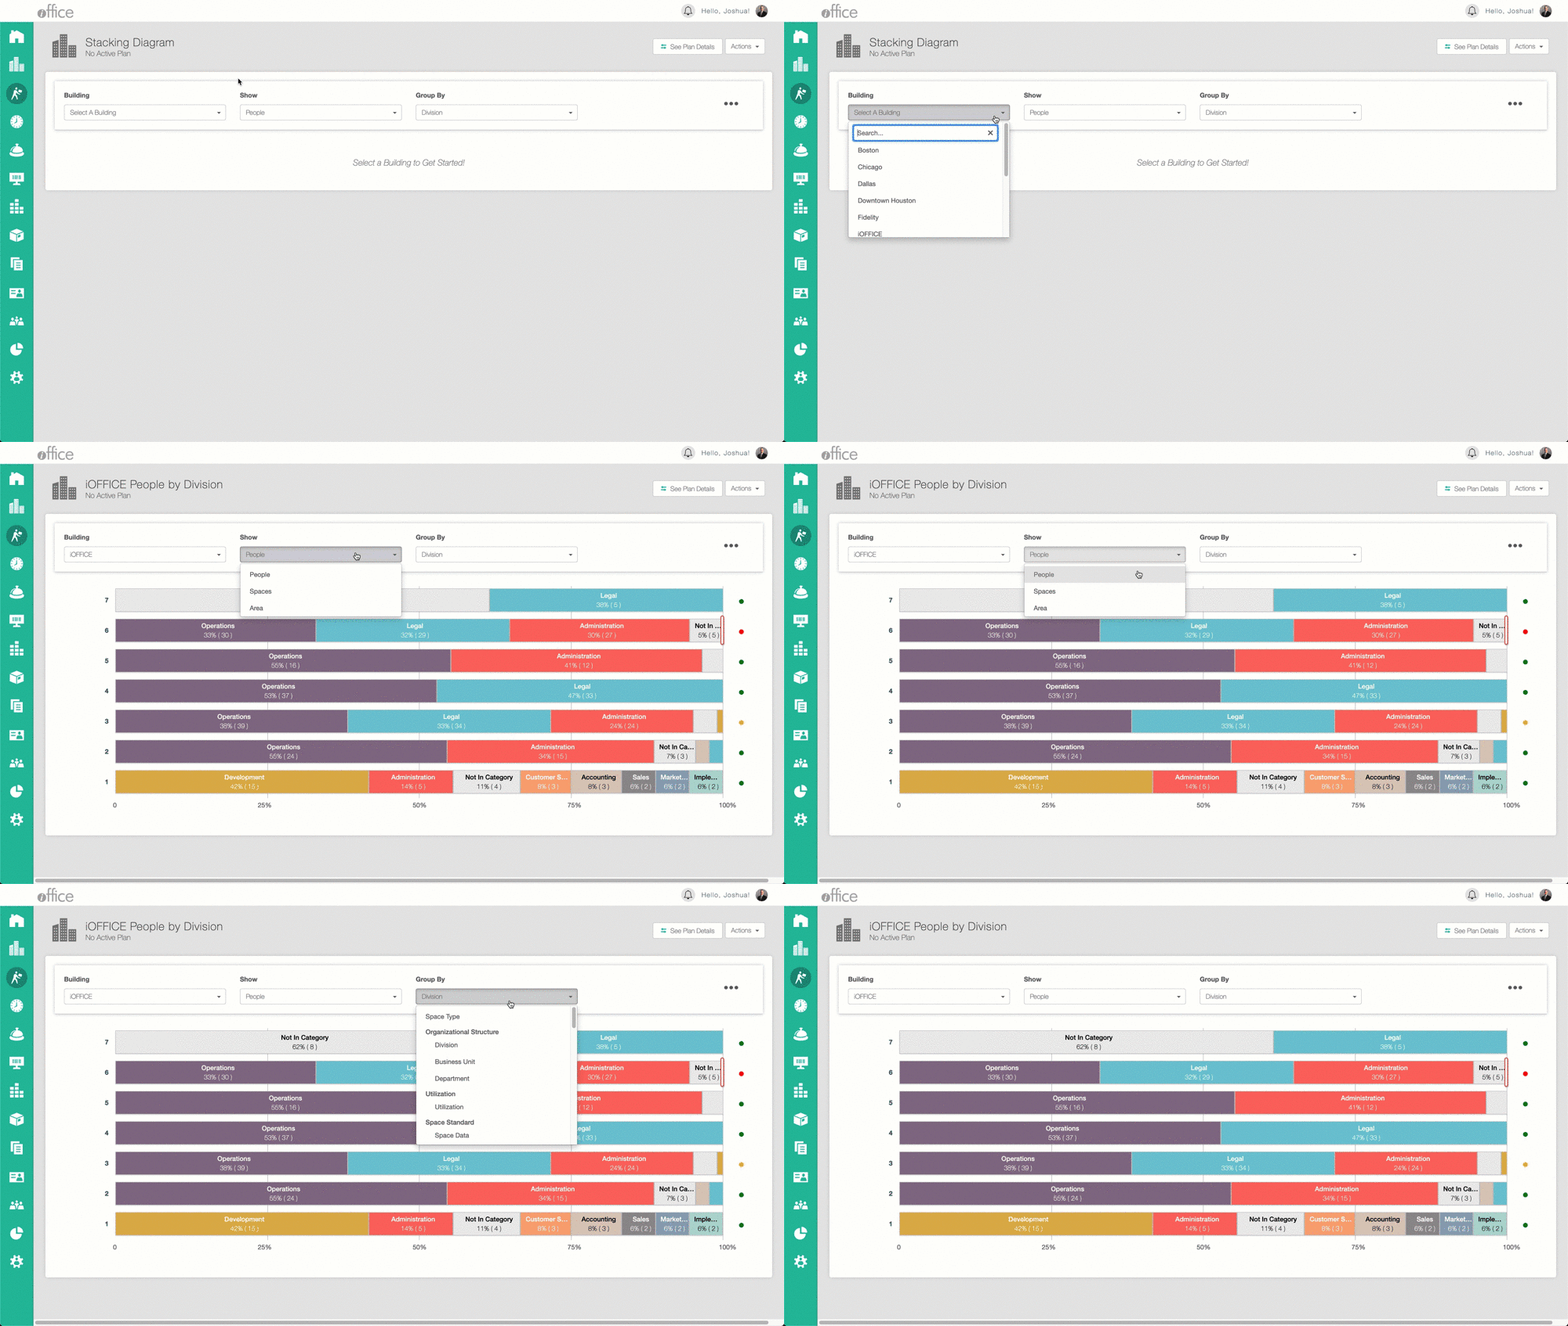
In the Stacking Diagram select a building, and how you want the data to be shown. Next, select how you want to group the data. It will then display the data based on your selections.
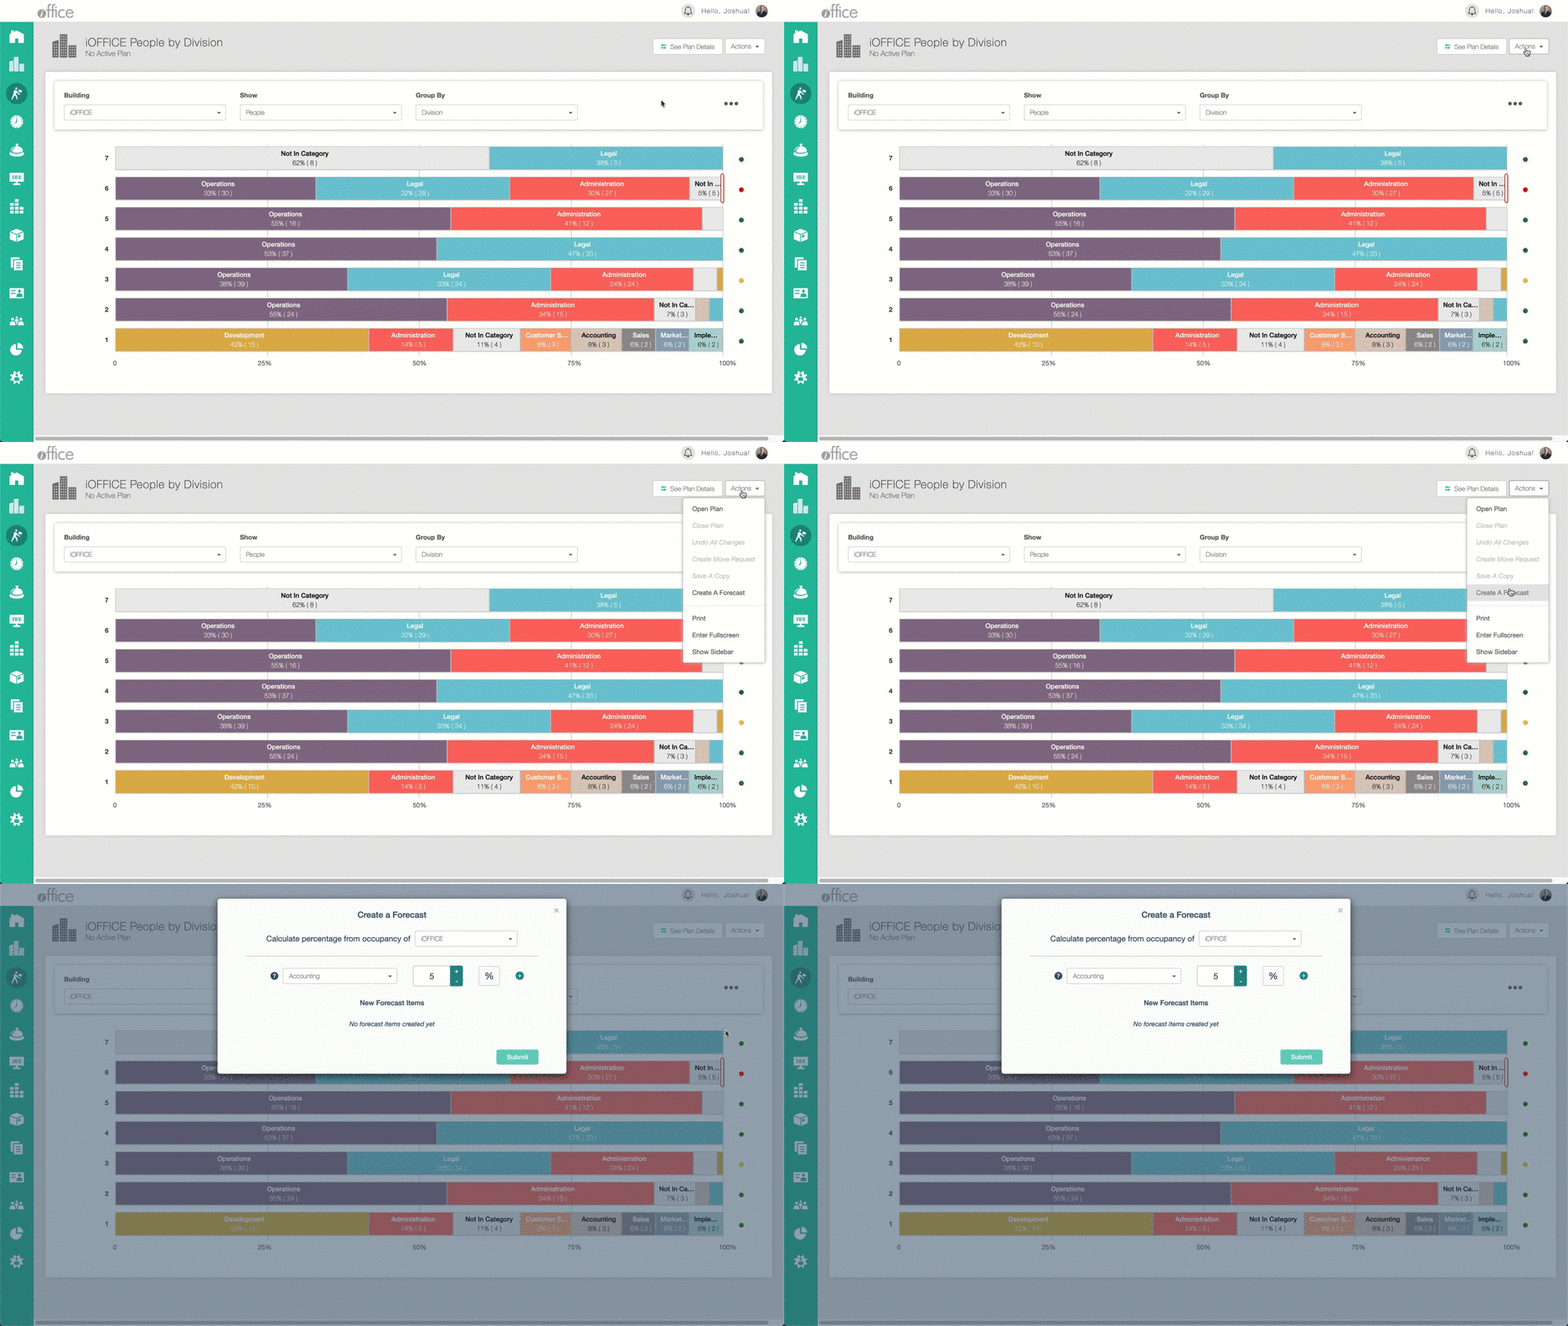
Once a selection is made the next step is to create a forecast. To create a forecast, click on Actions at the top right-hand corner, and then click on Create A Forecast.
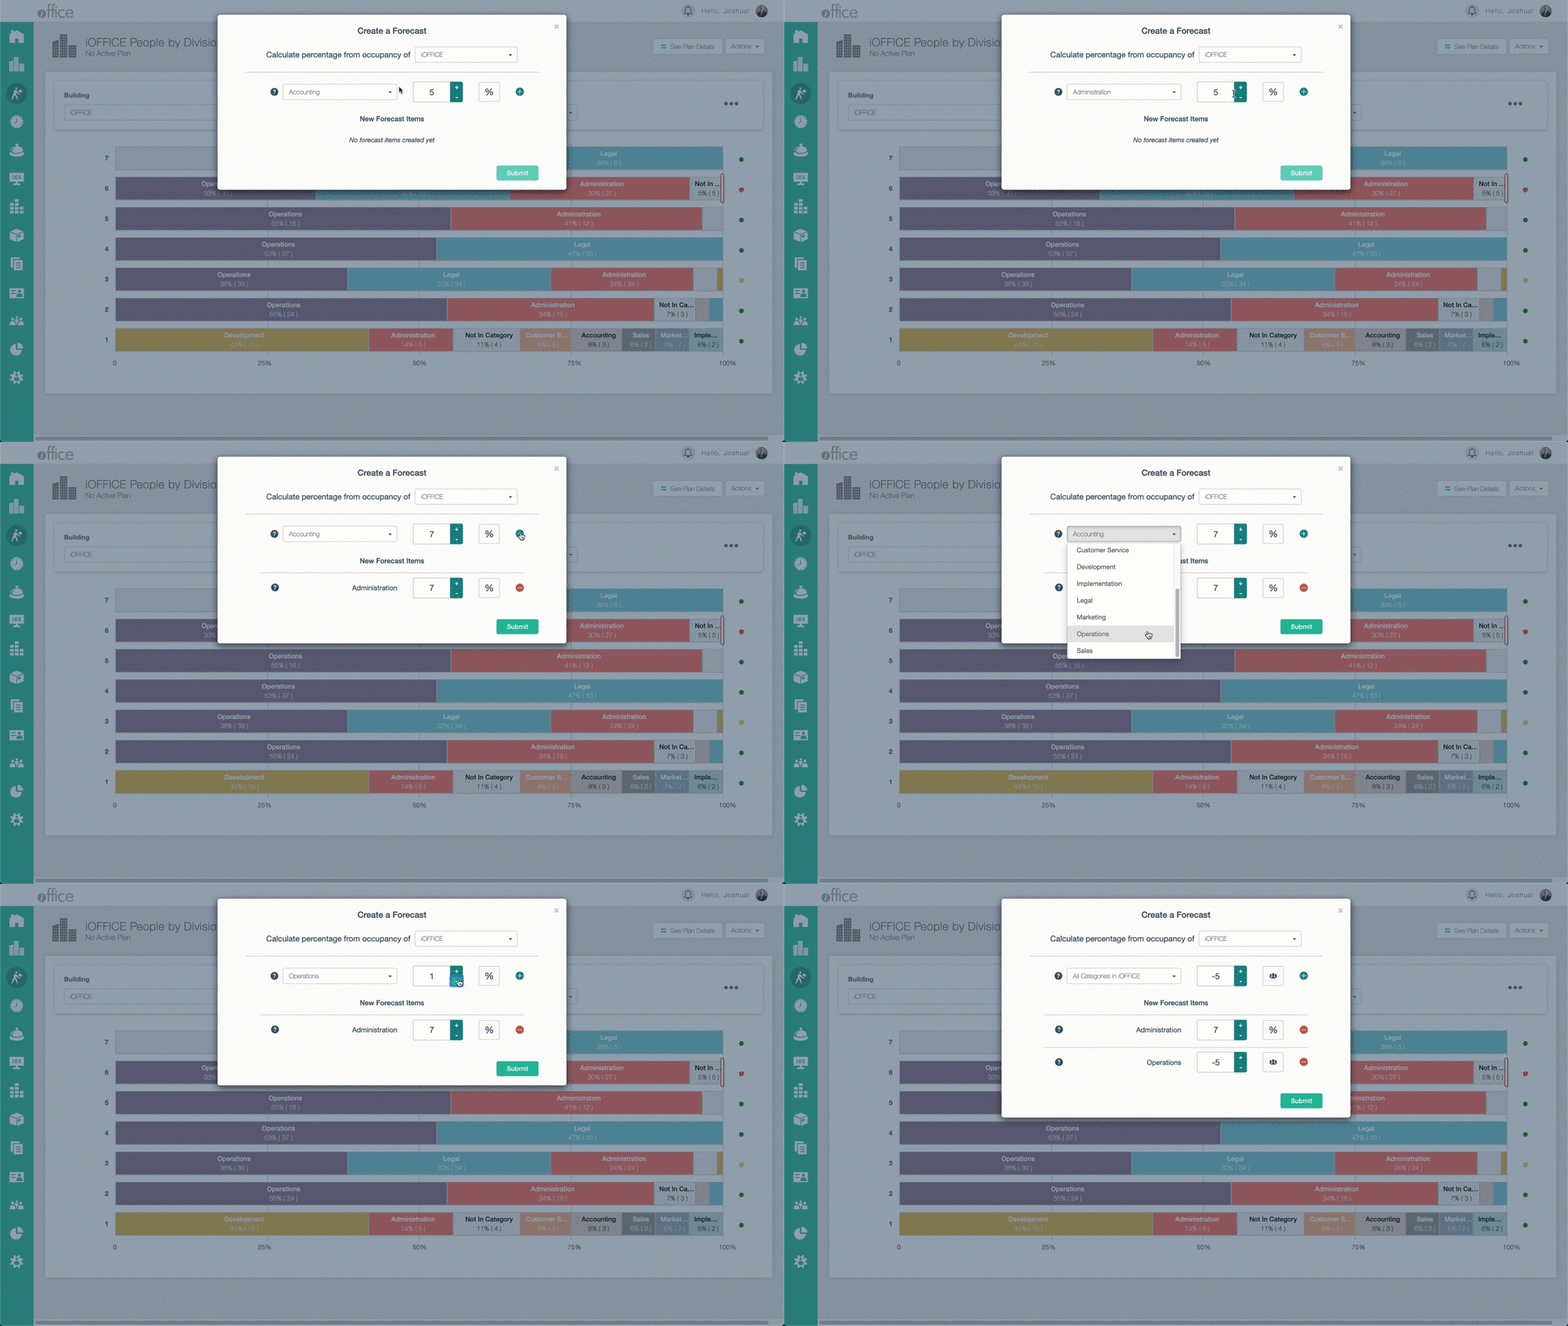
Based on your Group By selection, you will now be able to select which items you want to expand or reduce by. Expansion or reduction can be calculated by percent or headcount. To do this click on the drop-down and make a selection. Next, click on the plus or minus buttons to project an increase or decrease in your labor force. The next step is to then select if you want to calculate by percent or headcount. Click on the percent button to switch to the headcount or the icon of people to switch to percentage-based growth or reduction. Afterward, click on the green circle button with the plus sign in the middle, this will add your item. Multiple projections can be added to your forecast.
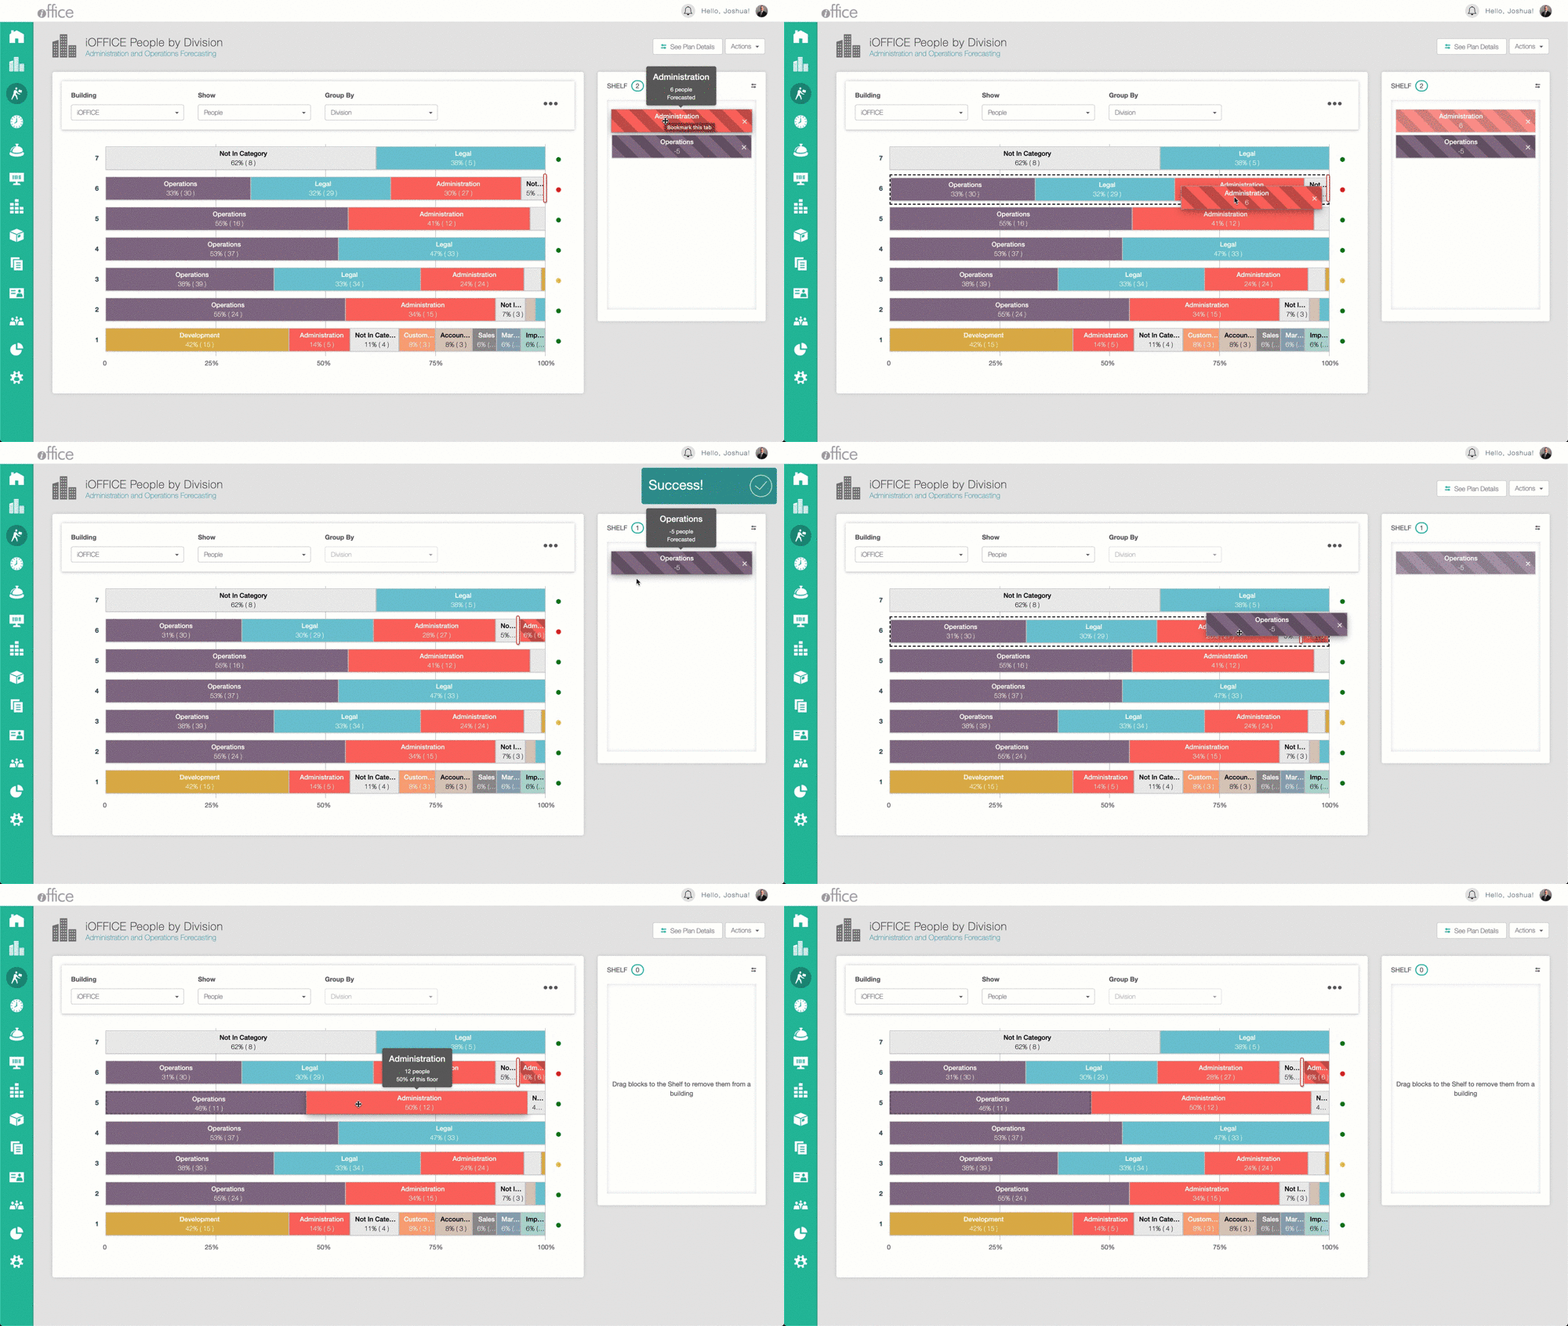
When your forecasting items are completed you can then click and drag your forecasting projections to your floors.
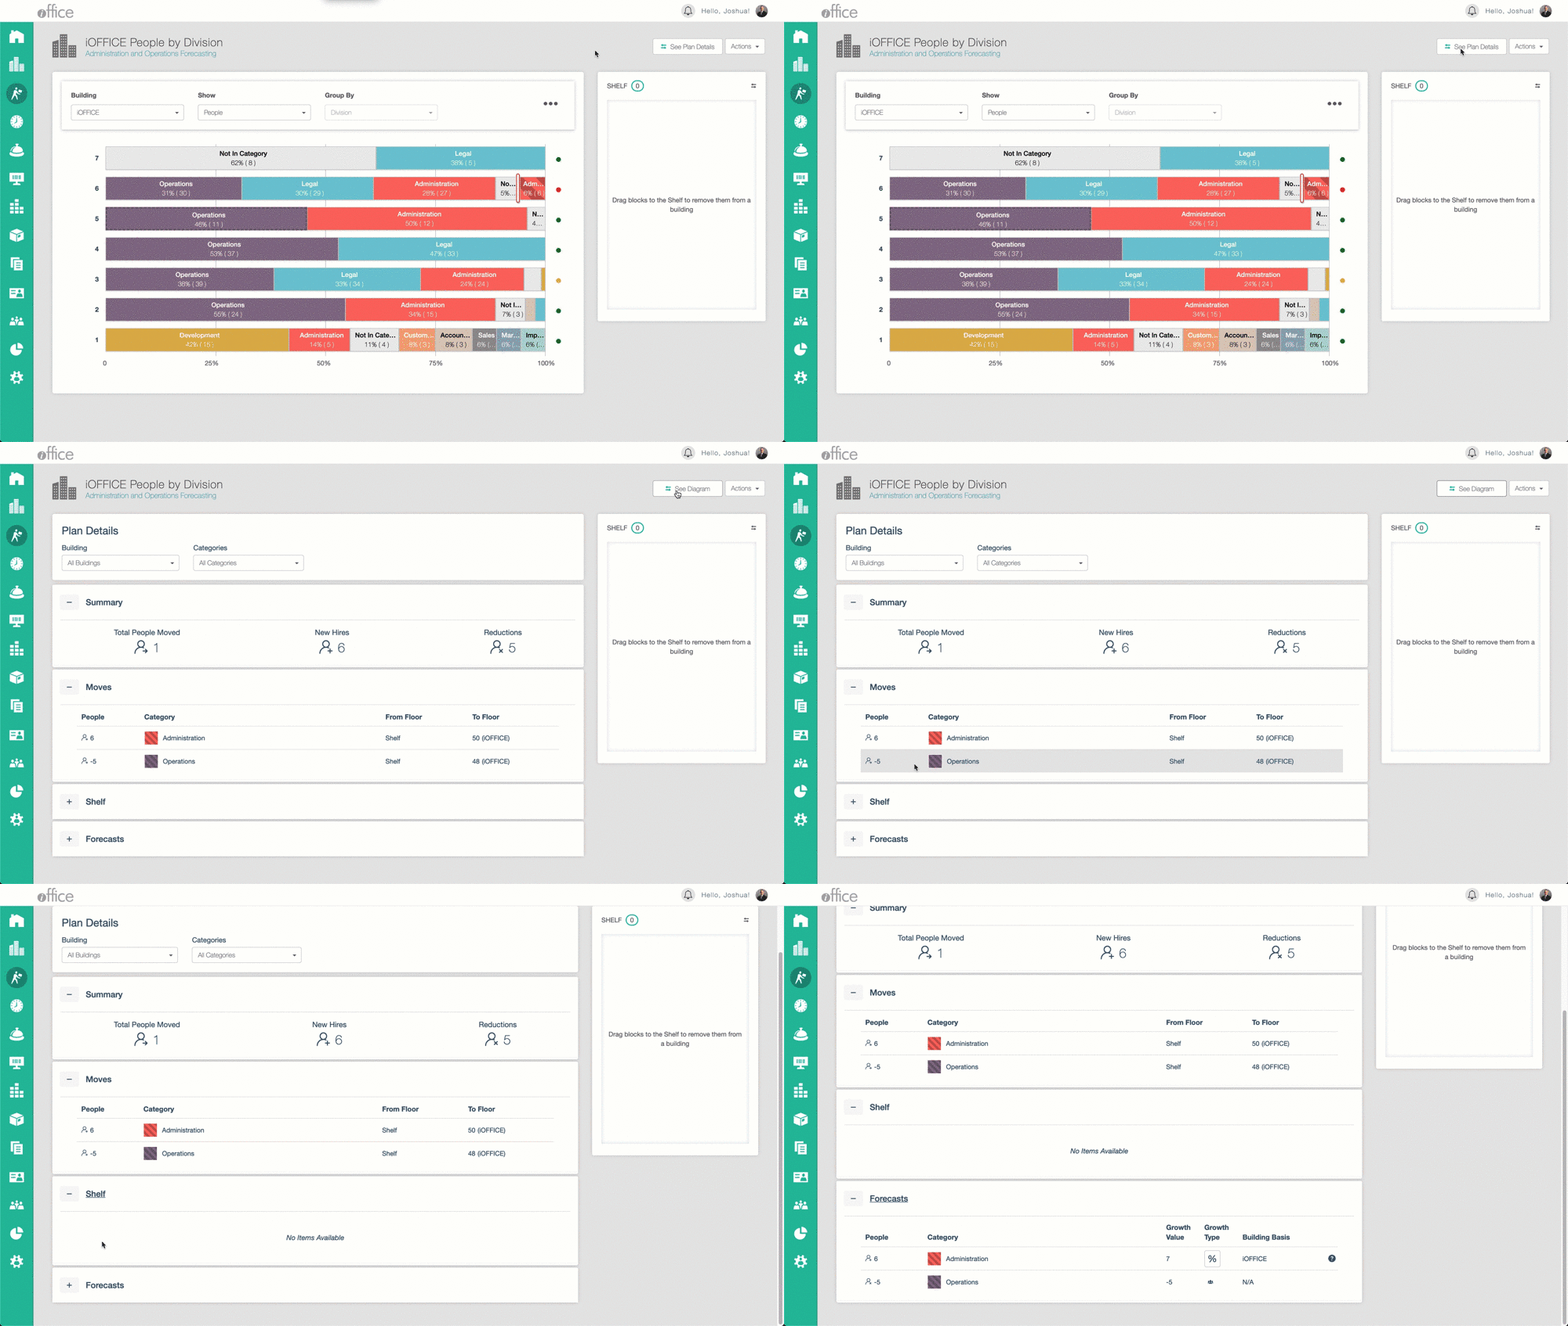
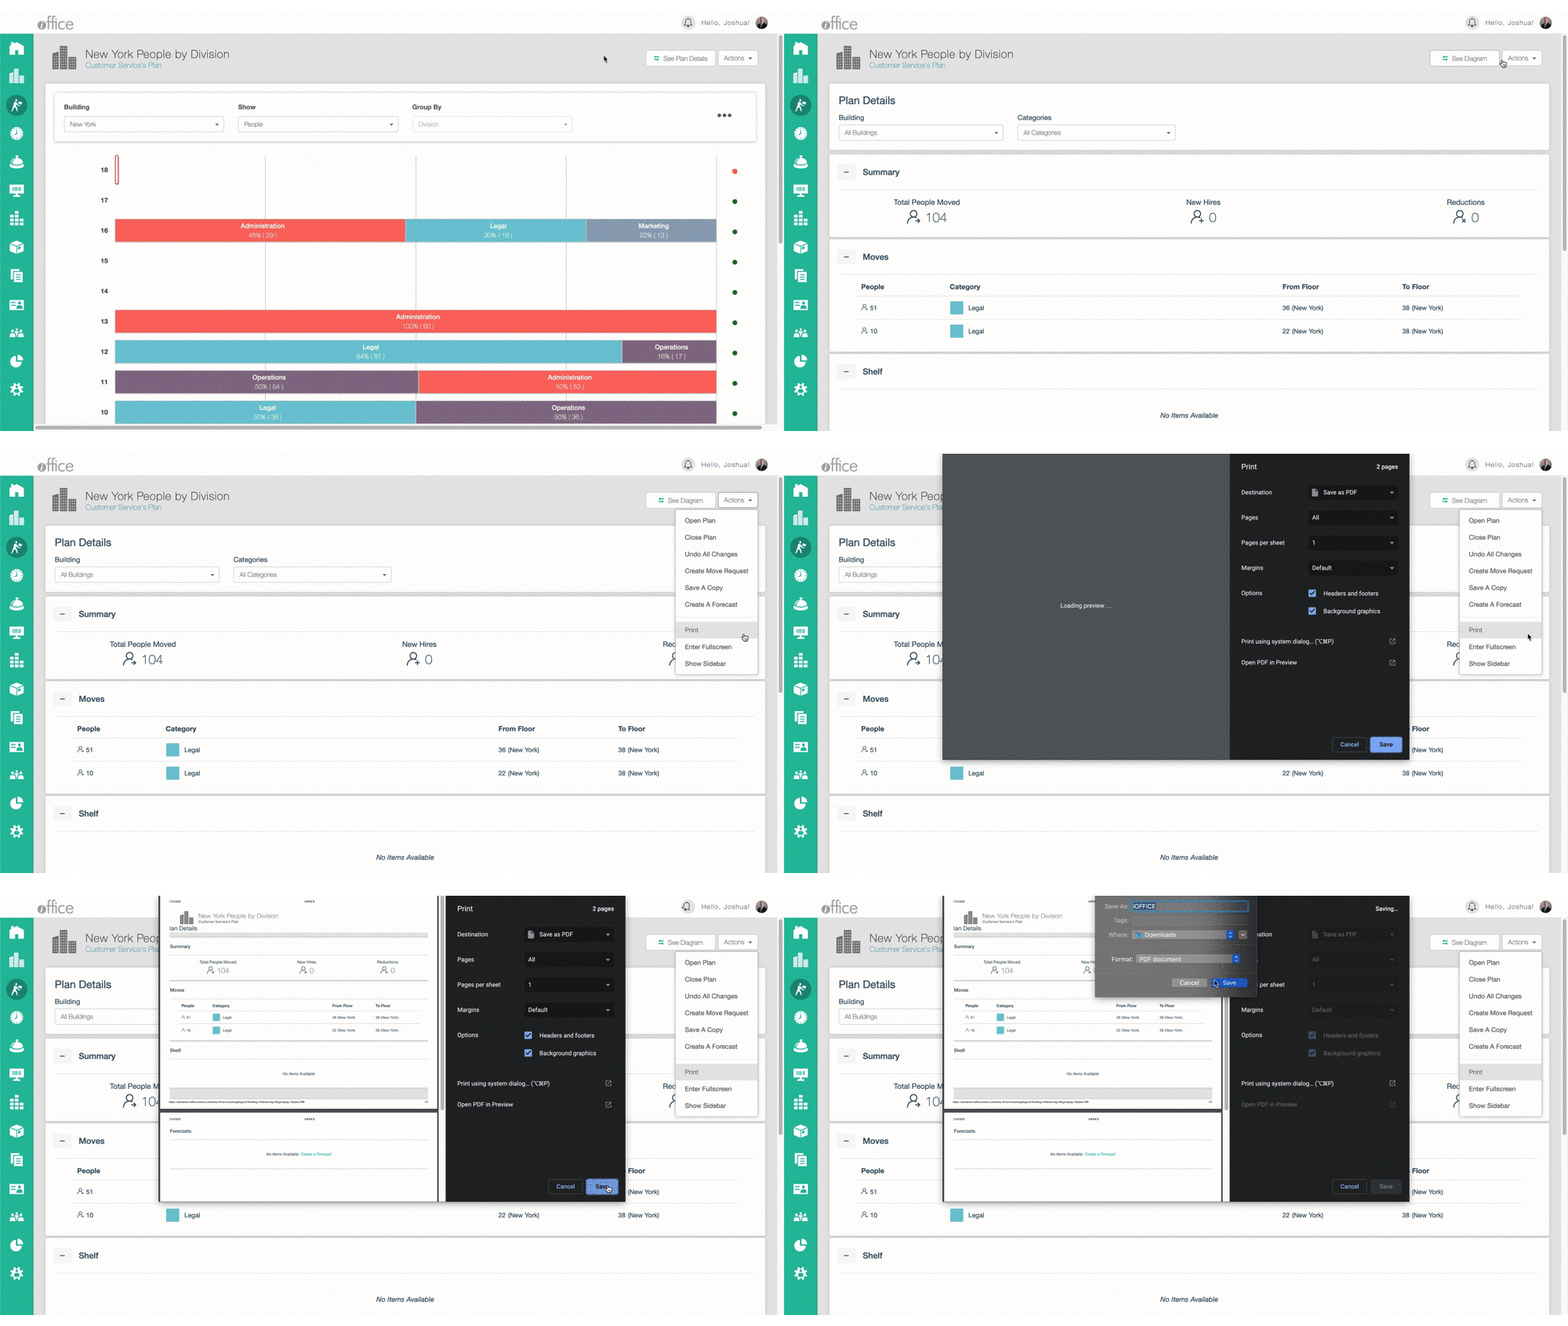
To see the plan details of your forecast, click on the See Plan Details. This will show you a summary of the plan. The Plan Details page will show the Total People Moved, New Hires, and Reductions. To go back to the Diagram, click on See Diagram if desired.
Splitting Forecasting Projections
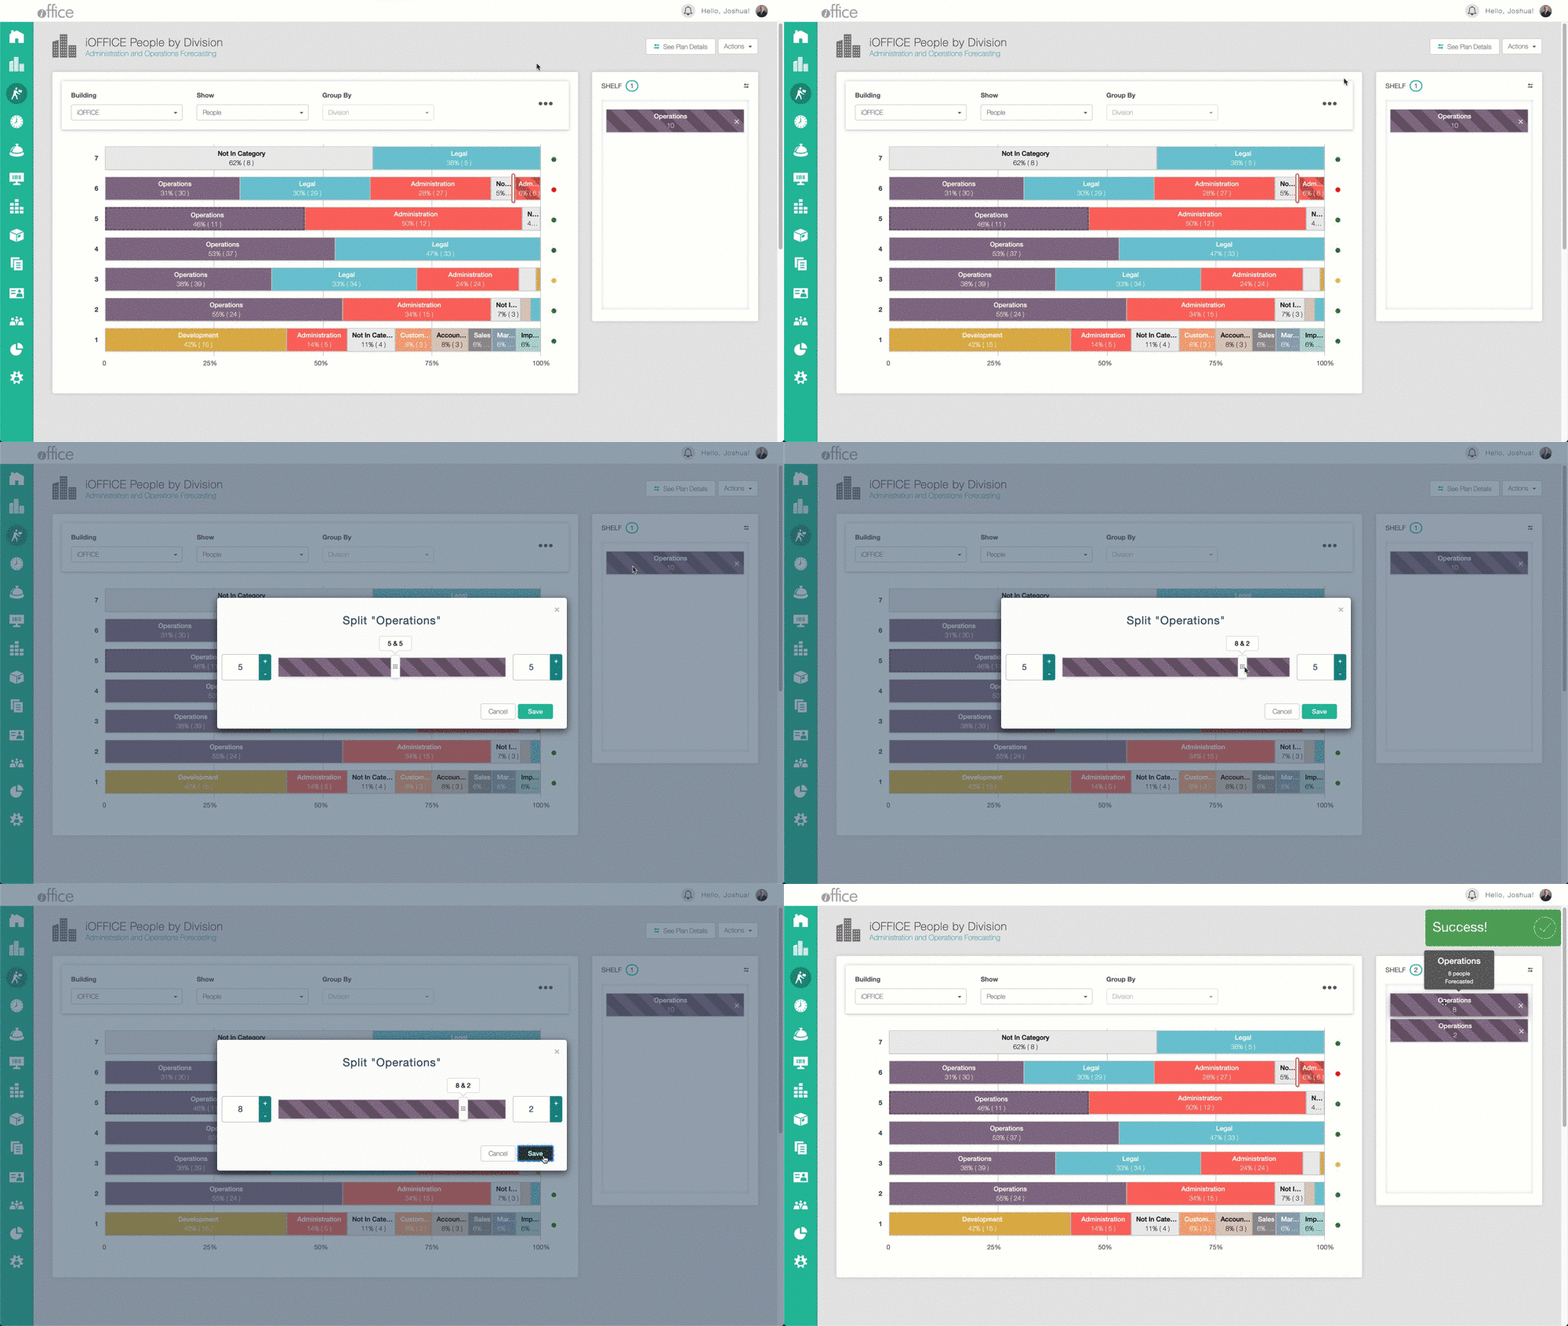
Once a Forecasting Element is created you can split the projections across multiple floors. To do this double click on the projection then use the slider bar to split your projection to the desired amount. Next click on the Save button to create your split forecasting projection, from here you can click and drag your forecasting projections to the appropriate floor.
Creating A Move Request From The Stacking Diagram
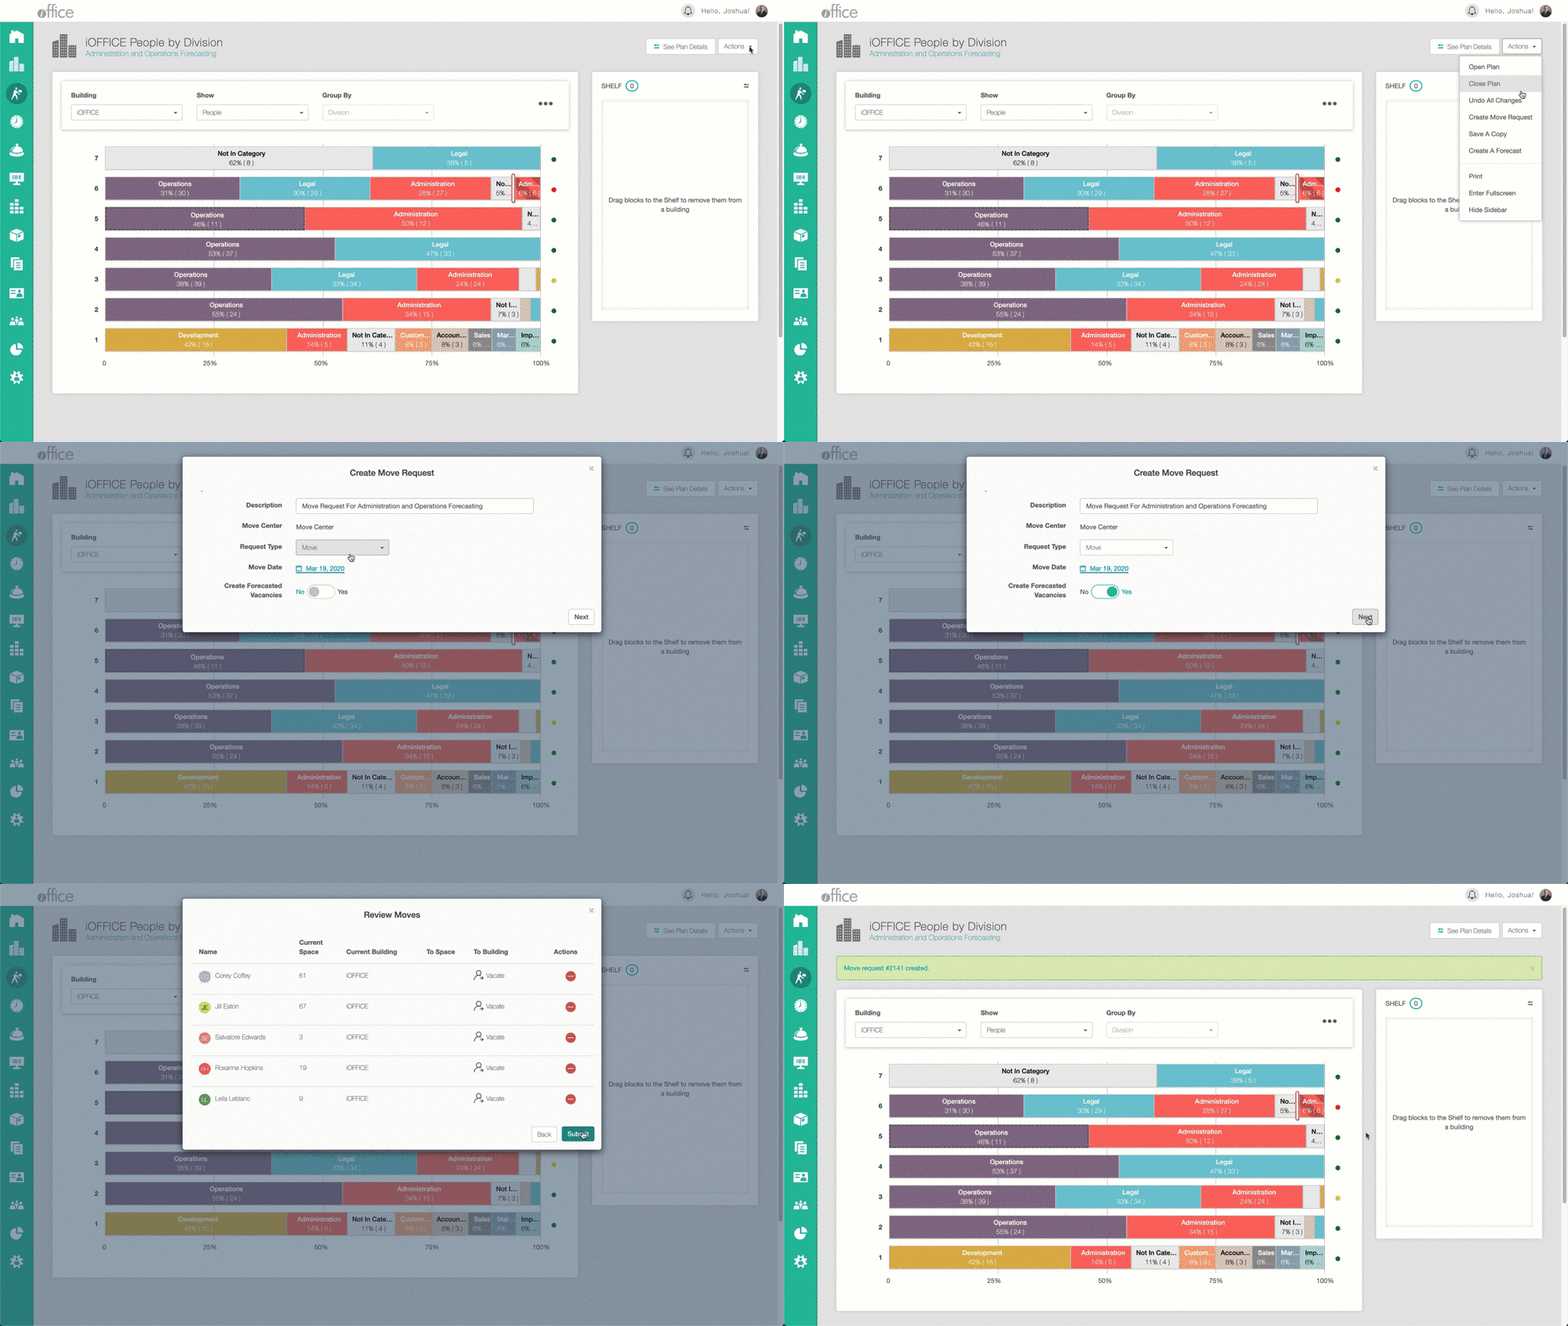
From the stacking diagram, you can also create a move request from this tool. To create a move request, click on Actions then Create Move Request. From here you can name your request, select a move date, and Create Forecasted Vacancies. After doing this click on Next at the bottom right-hand corner. It will then allow you to review your move. Afterward, click on submit and it will create your move ticket. The move ticket can then be viewed on Space Desktop or the Move Module.
Printing Forecasting Plan
To print a Forecasting Diagram Plan, click on see Plan Details. Then click on Actions and then Print.
Using the new space forecasting feature, you can now visualize your plan growth or reduction by your defined categories and depths. This powerful new feature also allows you to quickly view forecasted reductions visibly on your floor plans as well. If you have any questions please call 1-800-505-0224 or send an email to support@iofficecorp.com.
